Regional Development Committee
Public Transport Reform
Outline Business Case (May 2009)
Comment & Context
Translink
for Regional Development Committee of NI Assembly
16th September 2009
1. Public Transport (PT) Reform – Overview
PT Reform proposes changing the current structure to one of two options (do nothing is not an option);
- Change existing arrangements to meet EU 1370
- Establish a new agency in DRD to design, procure and regulate all public transport in NI
2. Public Transport Reform – Stated Objectives / current position
DRD stated aims of PT reform (at RDC 9 th September 2009) are
- Better integration of transport modes
- Wider availability / accessibility of public transport
- More affordable public transport
- Higher quality services at lower cost / better value for money
This is aligned to Translink’s current aspirations and it can be seen that the current structure delivers:
|
|
|
|
|
|
|
|
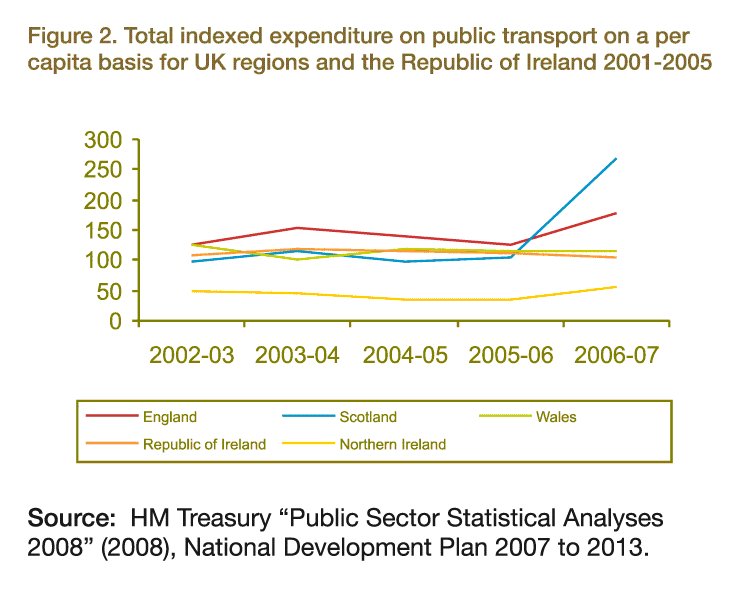
- Appendix 1 details current performance in terms of financing, usage, fares, customer satisfaction and schools
3. OBC Conclusions – Commentary / critique on proposed reformed organisational arrangements (from OBC chapter 5)
- If DRD are committed to a middle tier it will be vital that any public transport funding makes its way to front line services rather than increasing bureaucracy
- The OBC assumes that the agency could potentially deliver an extra £5.4m over 5 years at a cost of £907kpa giving a net saving of £173kpa (reinvestment of this could deliver probably 2 buses more of service)
- Although funding of core public transport in NI has been declining, Translink has made savings and increased efficiency year on year while significantly increasing usage of public transport.
- Fares and usage of public transport compare favourably with similar areas of GB
- Translink home to school transport is cheaper than ELBs
4. Conclusions
Translink is clear that there is a requirement to change current structures to be compliant with EU regulation1370 however this can be achieved by means of a direct award contract.
There is a real danger that introducing new structure may mean that available funding goes from delivering front line services to the establishment of an agency / increased bureaucracy.
Note: Translink is a public corporation, its shareholder is the minister and Translink is accountable to DRD. Translink has local management operating across the whole of NI making it part of the community and responsive to the community.
Appendix 1
Performance of Current Public transport System
1. Financing of Public Transport (ref. OBC para 2.15 onwards, page 15)
| 05/06 | 09/10 | 5 yr change | |
|---|---|---|---|
| Funding to Translink |
|||
| Subsidy | |||
| Bus (1) | 5.2 |
4.9 |
-5.8% |
| Rail (2) | 21.9 |
21.3 |
-2.7% |
| Concessions | 17.8 |
29.4 |
65.2% |
| Fuel duty rebate | 8.6 |
10.2 |
18.6% |
| Total |
53.5 | 65.8 | 23.0% |
| Funding to other operators (3) |
3 | 7.4 | 146.7% |
| Total |
56.5 | 73.2 | 29.6% |
Source - appendix 2
Definitions
(1) Subsidy for bus services includes transport programme for people for disabilities, rural transport fund, route revenue support (for socially necessary services) and partial funding of employer pension contributions
(2) Subsidy to rail is PSO (public service obligation) including partial funding of employer pension contributions
(3) Funding to other operators also includes concessions, fuel duty rebate, transport programmes for people for disabilities and rural transport fund
- Increased revenue funding has been to support government policy in the areas of
- concessions - where operators are refunded on the basis of no better, no worse i.e. it has no impact on the provision of public transport and is like free prescriptions or free glasses for certain chosen groups
- support to other operators in the provision of transport programmes for people with disabilities and rural dwellers.
- In contrast, funding of the core bus and rail services has declined; funding relative to passenger numbers shows the increasing efficiency of train provision with subsidy per passenger declining from £2.84 (2005/06) to £2.24 (2008/09) - a decline of 21%.
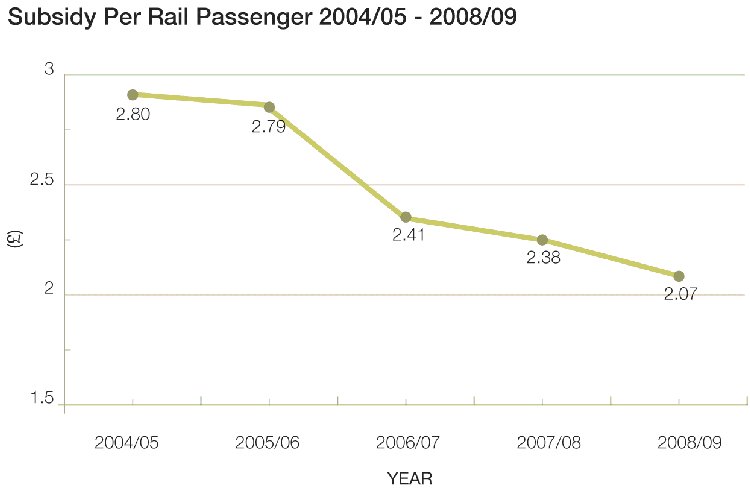
- By comparison, subsidy of bus services is very low level at just under 8p per capita. This is unchanged between 2008/9 and 2005/6
- While PT operators also get some of the duty on fuel rebated (same for private sector operators in GB), as government policy has been to increase duty on fuel this has increased the cost of ‘fuel duty rebate’ although DRD have not covered the fuel duty increase of April 2009 and the planned increase of September 2009 and this will need to be passed on to customers.
- These subsidy reductions have been at a time when costs, such as labour and pensions (a significant part of public transport costs) have gone up very substantially.
2. Capital Funding of Public Transport
- Capital investment, though varying over the period identified in appendix 2 is now lower than in 2004/5; figures quoted are ‘actual’ spend so the declines in real terms have been greater
- Capital investment in the bus business going forward (OBC table 2) will only keep the fleet in an ‘as is’ position with minimal investment in workshops and bus stations; it could be described as ‘sustainable’ levels rather than ‘development’ levels
- Capital investment in the rail business going forward present issues regarding the timing of the relay of the Coleraine to Derry and Knockmore / Lurgan lines
3. Public Transport Usage (OBC para 2.20 onwards, page 17)
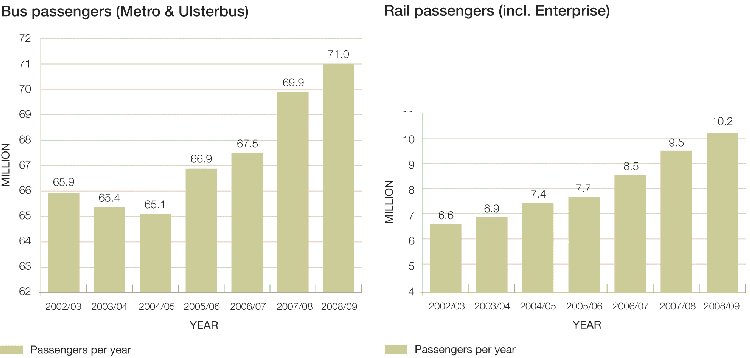
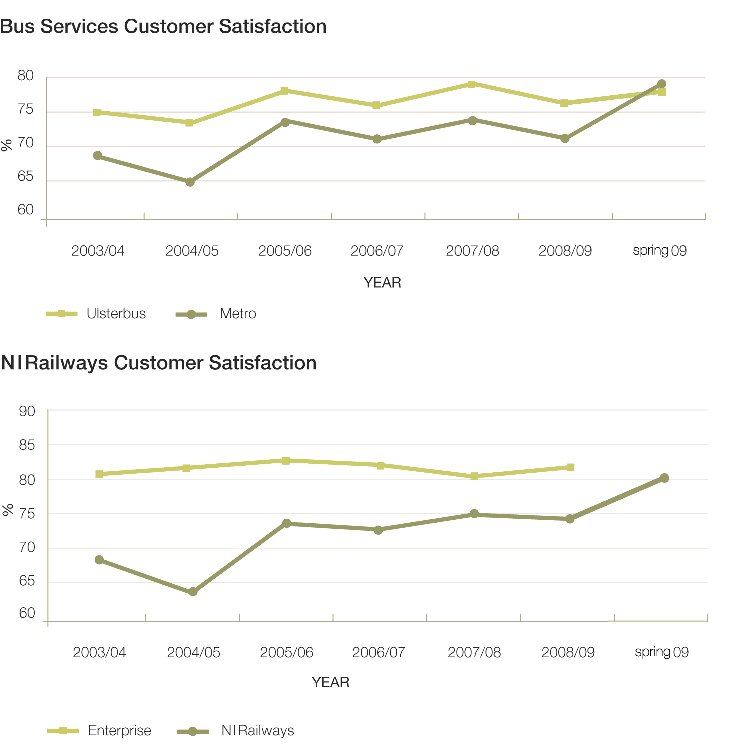
- Public transport usage in Northern Ireland has grown significantly in recent years and already compares well with equivalent areas of GB (customer satisfaction as measured independently is at an all time high)
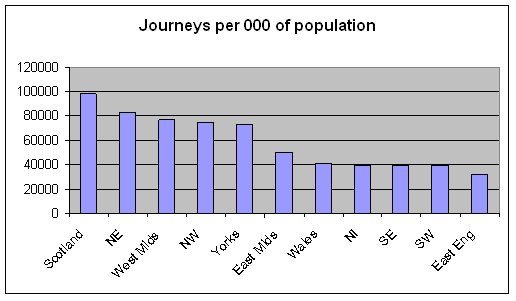
- The closest comparator geography is Wales, as the chart below shows NI comes only just behind Wales in terms of usage – and beats the south west, south east and east of England. Geographies that are more urban, not surprisingly, have higher journeys per 000 population.
4. Fares (from OBC para 2.22, page 19)
- ‘Translink bus and rail fares generally compared favourably with other operators in similar areas’ (OBC para 2.22)
- Passenger growth, reducing subsidy and increasing efficiency has not been achieved at the passenger’s expense
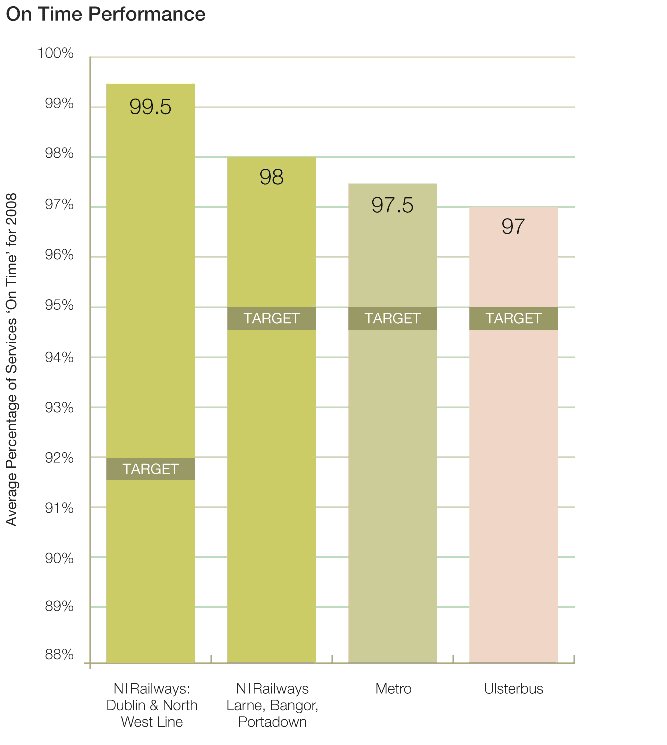
5. Customer satisfaction and punctuality
6. Home to school transport (OBC para 2.24, page 20)
- Translink home to school operations are very efficiently delivered (table 5)
- The index of cost per pupil for Translink is 80 compared with the ELB (excluding taxis etc) provision which indexes at 107; ELB provision is not such good value as Translink provision.
Appendix 3
Gross cost contracts
In a gross cost contract the tendering authority agrees to pay an operator a specified sum to provide the specified service for a specified period. Revenue from fares is passed to the tendering authority, which bears the ‘revenue risk’. The service provider generally carries the ‘cost risk’, though there may be provisions for cost increases to be passed through, such as elements of wage or fuel costs. Generally the tendering authority will take responsibility for working out routes, and may also specify the vehicles to be used.
Because the operator has no direct commercial relationship with passengers it is common for the tendering authority to provide a system of bonuses and penalties to give operators a financial incentive to provide the desired quality of service.
Net cost contracts
In a net cost contract the operator takes on both the revenue risk and the cost risk. It keeps the revenues from fares, and the tendering authority provides a contribution in the form of additional contracted income. This offsets obligations that the tendering authority may have to ensure the provision of a public transport service, or to meet social objectives where the cost of providing such a service would not be commercially viable if it depended solely on the fare income that it could achieve.
On especially popular and important services it may be possible of the tendering authority to reap a premium payment from the operator running these routes rather than providing financial support.
