EDUCATION COMMITTEE: BRIEFING PAPER ON PRIMARY FUNDING
+£200 AND +£800 PER PRIMARY PUPIL
COMPARATIVE FUNDING IN OTHER COUNTRIES
BUDGET ALLOCATIONS 2008/09: COMMON FUNDING FORMULA
OTHER NON-FORMULA FUNDING FOR PRIMARY in 2008/09
IMPACT OF THE 0.02 INCREASE TO PRIMARY WEIGHTING in 2008/09
CURRENT DIFFERENTIAL BETWEEN PRIMARY & POST-PRIMARY
ANNEX A
BACKGROUND and the COMMON FUNDING FORMULA (CFF)
2008/09 Factor distribution by phase
Primary funding increases – last 4 years
Demographic Changes
ANNEX B
Comparison of AWPU funding for Primary & Post-Primary
Small Schools
+£200 AND +£800 PER PRIMARY PUPIL
The Northern Ireland Primary Principals’ Action Group (NIPPAG) has called for the Northern Ireland Executive to step in with an immediate payment of £200 per primary pupil, and to ensure that the Department of Education raises primary school funding by £800 per pupil per year.
In the 2008/09 financial year there are approximately 156,000 primary pupils attending grant-aided schools.
- £200 per primary pupil equates (approximately) to an additional £31 million
- £800 per primary pupil equates to approximately £123 million more.
- To avoid impacting adversely on the budget shares of pupils at other phases, additional funding would need to be found from within the NI Block.
- To distribute an additional £200 per primary pupil through the Common Funding Formula would have required a total fund of almost 3% more than was available for all schools in 2008/09. To distribute an additional £800 per primary pupil would have required a total fund of almost 12% more than was actually distributed in 2008/09 (total funding requirement of £1,175m compared to actual £1,050m).
- The current overall per pupil differential between primary and post-primary is £1,375.
COMPARATIVE FUNDING IN OTHER COUNTRIES
- Direct comparisons between funding here and other countries are, in many cases, not appropriate due to:
- different structures and funding regimes (eg 6 th form funding);
- different starting age and transfer ages; and
- extent of delegation.
- International comparisons are difficult, due to variations in the timing of research, definitions used and levels of delegated autonomy – and the nature and emphasis placed on addressing particular needs such as the incidence of small schools and levels of social deprivation. For example, the figures quoted for the UK in the OECD publication 'Education at a Glance 2007' relating to finance were provided by DfES (DCSF). However, the next edition of the report due to be published in September of 2008 will use a different source - "the historic data sources used for previous returns are no longer available and a new approach has been developed using Treasury data." Comparisons of total budget and expenditure on education across regions, therefore, need to be treated with caution.
- Additionally, at each phase of education, account needs to be taken of specific variations, such as levels of delegation (for example many LEA schemes have funds for services – such as school meals, landlord maintenance etc.- delegated which are not here).
- It is, however, recognised that the funding differential between primary and post-primary schools should be smaller than it is currently. However, as all recurrent school funding comes from the one budget, unless the overall budget is significantly increased, it is not possible to increase funding to the primary sector without a corresponding reduction in the funding for post-primary schools.
- The Department is committed to reducing that differential and in doing so, the challenge will be to reduce the differential in a way which recognises the value of primary education yet does not create difficulties for the post-primary sector and which also recognises the difference in the costs involved in delivery of the curriculum in each phase.
BUDGET ALLOCATIONS 2008/09: COMMON FUNDING FORMULA
- The main source of funding for schools’ delegated budgets is the Common Funding Formula. Common Funding for schools is designed to achieve an equitable and transparent division of funds across all schools based on their relative level of need.
- The common funding formula is made up of a range of factors developed to reflect the main costs associated with the running of a school and the main funding factor within the formula, the Age Weighted Pupil Unit (AWPU) factor, is driven by pupil numbers. Pupil numbers are weighted in order to reflect the differing costs to each phase of education in delivering the school curriculum and the differential in per-capita funding between a primary pupil and a post-primary pupil arises largely from this.
- Of the total £20.4m uplift for funding in 2008/09 - primary schools received £12.67m (62%) – a cash uplift of over 3% (or 4% per pupil taking account of demography);
- Average primary per pupil increase £102 per pupil (higher than that (£98) for post-primary)
Funding £ million |
2007/08 CFF Funding & CYP £m |
2008/09 CFF Funding £m |
Variance £m |
% Variance |
|---|---|---|---|---|
Nursery |
16.8 |
17.1 |
0.2 |
1.34% |
Primary incl. GMI |
416.3 |
428.9 |
12.7 |
3.04% |
Post Primary incl. VGS & GMI |
596.5 |
604.0 |
7.5 |
1.26% |
ALL SCHOOLS |
1,029.6 |
1,050.0 |
20.4 |
1.98% |
PER CAPITA AVERAGES |
2007/08 CFF & CYP |
2008/09 CFF |
Variance |
% Variance |
|---|---|---|---|---|
Nursery |
£3,406 |
£3,462 |
56 |
1.64% |
Primary incl. GMI |
£2,544 |
£2,646 |
102 |
4.01% |
Post Primary incl. CG, VGS & GMI |
£3,923 |
£4,021 |
98 |
2.50% |
ALL SCHOOLS |
£3,211 |
£3,309 |
98 |
3.07% |
- The Department is committed to ensuring that the funding for primary and early years continues to receive high priority, and the funding formula arrangements will reflect this – within total resources available. Changes to the formula funding budgets delegated to schools in 2008/09 sought, within finite budgets, to maximise increases to primary schools (without adverse impact on other phases).
OTHER NON-FORMULA FUNDING FOR PRIMARY in 2008/09
- In addition to the schools Common Funding budget, significant additional funding is being made available, including over the next three years, specific additional support for primary such as:
- £32m for the Foundation Stage of the revised curriculum in primary schools;
- £12m specifically to help primary school teaching Principals;
- Along with a range of funding to enable Early Years services to be funded, and a £12m Literacy and Numeracy programme.
Support for early primary (Foundation & MAGS)
- In 2008/09, primary schools have received their share of the total £17.5m, including an additional £7m to support primary schools with the delivery of the Foundation Stage.
- Across the current budget period, 2008/09 to 2010/11, a n additional £32 million is being made available, with over £62m in total being made available directly to support primary schools over the 3-year period.
MAGS/FOUNDATION BASELINES FOR THE PERIOD 2008 TO 2011 |
||||
Budget |
2008/09 £m |
2009/10 £m |
2010/11 £m |
Total |
MAGS P1 |
9.4 |
9.7 |
9.9 |
29.0 |
MAGS P2 |
1.1 |
0 |
0 |
1.1 |
Foundation |
7.0 |
12.5 |
12.6 |
32.1 |
Total |
17.5 |
22.2 |
22.5 |
62.2 |
- Funding of circa £17.5m in 2008/09 equates to approximately £122 per primary pupil (or £414 for every Primary 1 and Primary 2 pupil, in supporting schools in the delivery of the Foundation stage and Making a Good Start).
Support for Primary Teaching Principals
- The Department has secured additional resources to provide additional support which recognise the demands on primary school teachers, and in particular on teaching principals.
- Through the LMS Small Schools factor some provision is already made to enable the release of teaching principals of smaller primary schools from class contact for at least one day a week.
- The Budget provides for a further day in line with the recommendation in the Curran 2 Report from September 2008.
- The Department is currently considering methodologies to allocate this resource efficiently and effectively. In 2008/09, this will make available additional funding of £2.5m for eligible primary schools, to cover the period from September 2008 to March 2009.
- The additional funding being made available to support primary teaching principals, across the Budget period, is:
2008/09 £2.5m
2009/10 £4.5m
2010./11 £4.6m
IMPACT OF THE 0.02 INCREASE TO PRIMARY WEIGHTING in 2008/09
- As outlined in the Autumn 2007 Consultation on a possible change, roughly £1.8m more is distributed across primary for each 0.01 increase in primary pupil weighting.
- Primary funding is £3.7m more in 2008/09 as a result of the increase of 0.02 (from 1.02 in 2007/08 to 1.04 in 2008/09). Any increase beyond 1.04 would have meant that the relative shares for pupils at other phases of education would have been reduced further.
- Within the £20.4m uplift to schools budgets for 2008/09 compared to 2007/08, some £12.67m was directed to primary schools, representing a cash uplift of over 3% and over 4% per pupil.
- Overall growth in public expenditure slower than in recent years; uplifts to NI Block and Education Budget share mean that ‘significant’ movement, in the short term, unlikely. However, Minister has already signalled that primary AWPU weightings will increase across CSR period and there will be a continuing focus on rebalancing per pupil funding, within available resources.
CURRENT DIFFERENTIAL BETWEEN PRIMARY & POST-PRIMARY
What is the current funding differential?
- After taking account of ALL funding factors, the average per pupil funding for primary schools amounts to £2,646 and £4,021 in post-primary schools; a difference (on average) of £1,375 per pupil.
- AWPU weightings are higher for post-primary pupils because the nature of the post-primary curriculum, its mode of delivery and the extent of support arrangements, such as staffing, equipment and resource materials, is quite different from that of the primary sector and, in the main, more expensive. Post-primary schools also have substantial examination entry fees to pay.
- In 2008/09, under current Local Management of Schools (LMS) funding arrangements, primary school pupils attract a weighting of 1.04 compared to 1.68 for pupils in Years 8-12 and 2.18 for sixth form pupils in post-primary schools.
- Premises size (and associated pupil numbers) in post-primary also generate proportionately more funding for this phase compared to primary schools. Post-primary schools are on average over 6 times the size of primary and the average pupil numbers in post-primary is over 3.5 times the average of a primary school.
Reasons for differential
- The differential reflects the greater cost demands which arise for post-primary schools in delivery of the curriculum. In the primary sector, the arrangements provide for a pupil centred approach with pupils normally taught in one class for all their subjects.
- The provision of a wider range of subjects by post-primary schools results in additional cost in areas such as teaching, materials and equipment, specialist facilities and examination fees. Practical classes must be conducted within specified maximum class sizes and in addition, post-16 classes tend to be small generally. In order to reflect this within the funding formula, different weightings are applied to primary and post-primary pupils and this creates the differential in the amount of per-pupil funding allocated on average to a primary school as compared to a post-primary school.
Age-weighted Pupil Unit differential
- In 2008/09, using the AWPU factor only for comparison purposes; a primary pupil in years 1-7 attracts funding of £2,045 that is a weighting of 1.04 x cash value of £1,966.16.
- A post-primary pupil in years 8-12 will attract funding of £3,303 that is a weighting of 1.68 x £1,966.16.
- The overall per pupil differential between primary and post-primary schools has been reduced, and primary schools are receiving an increasing share of the total available budget distributed to schools under the Common Funding Formula.
|
AWPU Only |
TOTAL FUNDING |
||
|---|---|---|---|---|
|
2007/08 |
2008/09 |
2007/08 |
2008/09 |
Primary to Post-primary differential £ |
-1,244 |
-1,258 |
-1,379 |
-1,375 |
% diff |
-39.3% |
-38.1% |
-35.2% |
-34.2% |
All pupils - includes nursery class in primary, preparatory pupils in post-primary
AWPU comparisons
- Whilst the Age Weighted Pupil Unit (AWPU) factor comprises the single largest element of the total budget, its use as a comparator is not wholly appropriate, as the funding formula for schools is comprised of a range of factors – which impact differently for each phase, and for individual schools at each phase.
- For example, in 2008/09 two of the other significant factors within the formula (Small Schools Support and Teachers’ Salary Protection) provided significantly more funding to primary compared to post-primary. The total funding distributed to primary schools under these two factors (approximately £200 per pupil), would otherwise enable a significant increase of around +0.1 of the AWPU weighting for primary pupils (based on 2008/09 values).
|
|
% total |
||
Primary Small Schools Support |
£26,225,488 |
78.3% |
||
Primary Teachers Salary Protection factor |
£4,862,544 |
80.8% |
||
Total |
£31,088,032 |
|||
Primary pupils |
156,081 |
|||
|
per pupil |
£199 |
||
Small Schools & Teachers Salary factors as an AWPU equivalent for primary schools |
0.1013 |
|||
- However, such a change would create unsustainable budgetary impacts for the large number of smaller primary schools (see Annex B). The fact that such a high proportion of the school’s budget is derived from the AWPU means that, in the case of smaller schools, the formula does not provide sufficient financial resources for the school to function effectively and deliver the curriculum.
Annex A
BACKGROUND and the COMMON FUNDING FORMULA (CFF)
- Replaced seven separate Schemes (in operation from 1991 to 2004), with a single formula based on common measures of identified need – for all schools in all areas – no sector or management type is treated differently;
- The Common Funding formula seeks to distribute available funding:
- equitably;
- transparently;
- on the basis of identified needs; and
- to help mitigate the impacts of social deprivation.
- Provides a mechanism to distribute available funding to (c. 1200) schools;
- LMS Steering Group (representatives from all key partner bodies and school sectors) and DE keep the funding scheme under constant review;
- Schools, representative groups and the Education Committee have a key role in bringing forward suggestions for change and moderation of the current Scheme;
- Any significant change to the current scheme for funding all schools is subject to consultation.
2008/09 Factor distribution by phase
The proportion of budget distributed under the various Common Funding Formula factors varies between phases. The proportion of funding provided for under the AWPU for primary school pupils is significantly less than other phases – Nursery schools receive some 87.5% of their total budget from AWPU funding, whereas for primary pupils this represents only 73.8% and 85.2% for post-primary.
2008/09 proportion of budget by Factor |
% Nursery School Funding |
% Primary Nursery Class |
Primary school pupils |
Post-Primary (incl. Prep) pupils |
|---|---|---|---|---|
Pupil AWPUs |
87.50% |
4.17% |
73.82% |
85.23% |
TSN |
5.69% |
0.20% |
5.72% |
3.73% |
Premises |
4.90% |
6.81% |
5.54% |
|
Small Schools Support |
0 |
|
6.38% |
1.23% |
Teachers Salary Protection |
1.27% |
1.14% |
0.16% |
|
Sports |
0 |
|
0.41% |
0.61% |
EAL, Travellers, Service pupils |
0.64% |
0.82% |
0.22% |
|
Irish Medium Support |
0 |
|
0.12% |
0.02% |
Special Units |
0 |
|
0.08% |
0.04% |
Landlord Maintenance* |
0 |
|
0.10% |
1.47% |
VAT* |
0 |
|
0.06% |
0.61% |
Administration Costs* |
0 |
|
0.16% |
1.14% |
TOTAL BUDGET 2007/08 |
100.00% |
100.00% |
100.00% |
|
Notes: * applies to GMI and VG schools only
Nursery schools are not included in a number of formula factors (eg Sports, Small schools), reflecting the assessed needs of this sector – who do not incur the same costs as others in delivering the curriculum (unlike post-primary, for example there are no specialist subjects, examinations, higher materials/book costs etc.).
Changes in the profile of pupils or funding distributed under the main factors (AWPU; Premises; TSN etc.) have a significant bearing on funding distributions (Annex B).
- Increases to primary AWPU increase the share for this phase (however, other factors (eg, small schools and Teachers Salary Protection) direct a significant proportion of the budget shares to primary and influence its overall funding.
- Changes to AWPU weightings cannot ‘guarantee’ the funding will go to a particular phase - “dispersed” as a result of changing needs and demography.
Primary funding increases – last 4 years
- The proportion of the overall ASB delegated budget directed to primary schools has increased from 39.7% in 2004/05 to 40.85% in 2008/09.
- Primary schools average per pupil funding increased by over 16% - at a higher rate than the average for the other phases:
Overall funding Per capita |
Per capita increase 0506 to 0809 |
|||||
|
2005/06 |
2006/07 |
2007/08 |
2008/09 |
£ |
% |
Nursery |
3,108 |
3,323 |
3,406 |
3,462 |
354 |
11.4% |
Primary |
2,279 |
2,439 |
2,544 |
2,646 |
366 |
16.1% |
Post-primary |
3,570 |
3,791 |
3,923 |
4,021 |
450 |
12.6% |
- Changes (both to AWPU weightings and other factors) contributed to increasing the proportion of funding for primary:
- An ‘un-weighting’ (per pupil element previously weighted by age group) of the premises element of formula funding;
- ‘Sports factor’ – to reflect the curriculum in primary, (many primary may not have such facilities on site, unlike larger post-primary schools);
- Increased support - Small Schools Support and Teachers’ Salary Protection factors (both of which make more funding available proportionately to primary compared to post-primary);
- Changes to AWPU weightings (from the range of weightings used prior to introduction of Common Funding); and
- An increase to primary AWPU weighting in each of the last two years.
TOTAL LMS funding over the last five years:
2004-05 £m |
2005-06 £m |
2006-07 £m (1) |
2007-08 £m (1) |
2008-09 £m |
|---|---|---|---|---|
875 |
954 |
1,005 |
1,030 |
1,050 |
(1) Includes £10m and £16m respectively from the Children and Young People Funding Package
2008/09 FORMULA FUNDING
Overall increase by phase
Phase |
2007/08 £m |
2008/09 £m |
Pupil decline % |
Increase Total Budget £m |
Total Budget increase % |
Per Pupil Increase £ |
Per Pupil Increase % |
|---|---|---|---|---|---|---|---|
Nursery |
16.8 |
17.1 |
-0.29% |
0.2 |
1.34% |
56 |
1.64% |
Primary |
416.3 |
428.9 |
-0.93% |
12.7 |
3.04% |
102 |
4.01% |
Post Primary |
596.5 |
604.0 |
-1.22% |
7.5 |
1.26% |
98 |
2.50% |
ALL |
1,029.6 |
1,050.0 |
-1.05% |
20.4 |
1.98% |
98 |
3.07% |
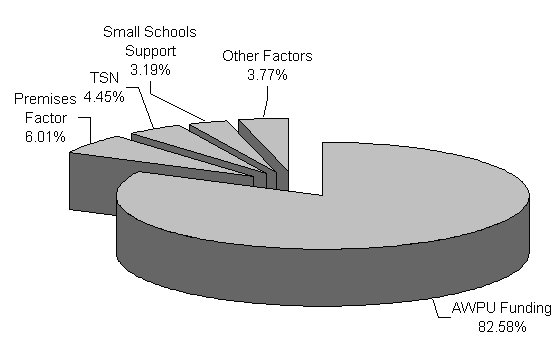
BREAKDOWN OF FUNDING FACTORS by distribution in 2008/09 |
% ASB |
|---|
Pupil AWPU Funding |
£867,118,119 |
82.58% |
Premises Factor |
£63,110,107 |
6.01% |
TSN |
£46,695,035 |
4.45% |
Small Schools Support |
£33,495,702 |
3.19% |
Landlord Maintenance (1) |
£9,071,230 |
0.86% |
Administration Costs (1) |
£7,397,260 |
0.70% |
Teacher Salary Protection |
£6,020,237 |
0.57% |
Children with English as an Additional Language |
£5,463,953 |
0.52% |
Sports Factor |
£5,363,681 |
0.51% |
VAT (1) |
£3,952,685 |
0.38% |
Children of the Travelling Community |
£755,988 |
0.07% |
Irish-medium pupils and Units funding |
£646,251 |
0.06% |
Special Units Lump Sum |
£570,000 |
0.05% |
Children of Service Personnel |
£339,752 |
0.03% |
TOTAL FUNDING |
£1,050,000,000 |
|
|---|
(1) Applicable to Voluntary Grammar and Grant-Maintained Integrated schools only.
Demographics Changes
FTE PUPIL CHANGE 0708 TO 0809 |
2007/08 |
2008/09 |
Variance |
% Variance |
|---|---|---|---|---|
Nursery |
4,945 |
4,930 |
-15 |
-0.29% |
Primary |
163,651 |
162,135 |
-1,516 |
-0.93% |
Post-Primary |
152,068 |
150,220 |
-1,848 |
-1.22% |
ALL SCHOOLS |
320,663 |
317,285 |
-3,378 |
-2.43% |
NB: Primary includes Nursery Class
Free School Meals |
2007/08 |
2008/09 |
Variance |
% Variance |
|---|---|---|---|---|
Primary pupils |
30,522 |
28,645 |
-1,877 |
-6.15% |
Post-Primary |
27,528 |
25,656 |
-1,872 |
-6.80% |
TOTAL All Schools |
58,050 |
54,301 |
-3,749 |
-6.46% |
Nursery school & Class JSA/IS
|
Variance 2007/08 TO 2008/09 |
||
|---|---|---|---|
Job Seekers/Income Support |
FT JSA |
PT JSA |
FTE JSA |
2007/08 |
1,215 |
200 |
1,315.0 |
2008/09 |
1,189.00 |
111.00 |
1,244.5 |
Change |
-26 |
-89 |
-70.5 |
% change |
-2.1% |
-44.5% |
-5.4% |
Annex B
Comparison of AWPU funding for Primary & Post-Primary
Use of AWPU comparisons in isolation fails to take account of the range of formula factors which combine to distribute the total of each schools’ delegated budget, including certain factors which proportionately support primary schools compared to post-primary.
For example, in 2008/09 two of the other factors within the formula (Small Schools Support and Teachers’ Salary Protection) the majority of funds go to primary schools, equating to approximately £200 per pupil. In AWPU terms, this equates to around +0.1 of the AWPU cash value in 2008/09.
|
|
% total |
||
Primary Small Schools Support |
£26,225,488 |
78.3% |
||
Primary Teachers Salary Protection factor |
£4,862,544 |
80.8% |
||
Total |
£31,088,032 |
|||
Primary pupils |
156,081 |
|||
|
per pupil |
£199 |
||
Small Schools & Teachers Salary factors as an AWPU equivalent for primary schools |
0.1013 |
|||
The Funding Formula is made up of a range of factors which seek to fund all schools according to identified need. There are a significant number of smaller primary schools (see below) and the Small Schools Support factor is intended to target more resources to these schools to facilitate the delivery of the curriculum (and in the case of primary schools to provide some support to facilitate principals to take one day release from full time class teaching commitments in order to undertake management and administrative responsibilities).
Small Schools
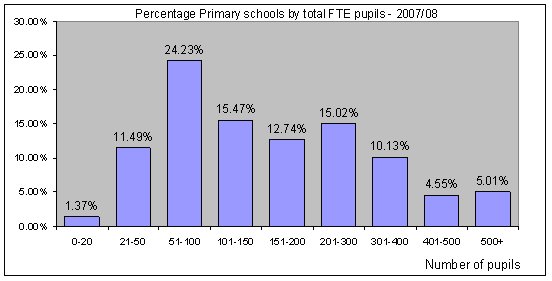
(Note: includes Nursery class pupils in primary)
The fact that such a high proportion of the school’s budget is derived from the AWPU means that, in the case of smaller schools, the formula does not provide sufficient financial resources for the school to function effectively and deliver the curriculum. Factors such as the Small Schools Support factor and support from others such as Teachers’ Salary Protection funding, play a significant role in supporting the large number of smaller schools – particularly in primary where (2007/08) there were over 62% of schools below the overall average size of 186 pupils, and over 37% of primary schools with 100 pupils or less.
The formula also takes account of the difficulties, particularly for smaller schools with relatively smaller budgets, of those schools with above average teaching costs – compared to the average for that phase. The majority of funding distributed under this factor (80+%) goes to primary schools.
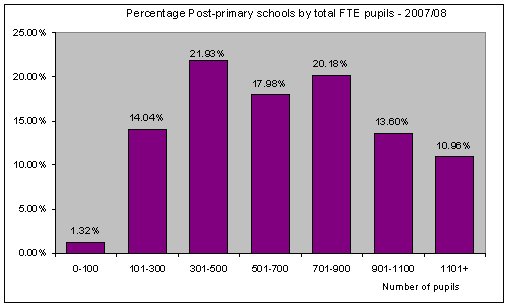
Post-primary
Whilst there are a number of smaller post-primary schools, there is a more even distribution with around half of post-primary schools (52%) below the average size (667 pupils in 2007/08), and 37% below 500 pupils.