| Homepage > The Work of the Assembly > Committees > Statutory > Enterprise, Trade and Investment > Reports | |||||||||||||||||||||||||||||||||||||||||||||||||||||||||||||||||||||||||||||||||||||||||||||||||||||||||||||||||||||||||||||||||||||||||||||||||||||||||||||||||||||||||||||||||||||||||||||||||||||||||||||||||||||||||||||||||||||||||||||||||||||||||||||||||||||||||||||||||||||||||||||||||||||||||||||||||||||||||||||||||||||||||||||||||||||||||||||||||||||||||||||||||||||||||||||||||||||||||||||||||||||||||||||||||||||||||||||||||||||||||||||||||||||||||||||||||||||||||||||||||||||||||||||||||||||||||||||||||||||||||||||||||||||||||||||||||||||||||||||||||||||||||||||||||||||||||||||||||||||||||||||||||||||||||||||||||||||||||||||||||||||||||||||||||||||||||||||||||||||||||||||||||||||||||||||||||||||||||||||||||||||||||||||||||||||||||||||||||||||||||||||||||||||||||||||||||||||||||||||||||||||||||||||||||||||||||||||||||||||||||||||||||||||||||||||||||||||||||||||||||||||||||||||||||||||||||||||||||||||||||||||||||||||||||||||||||||||||||||||||||||||||||||||||||||||||||||||||||||||||
Committee for Enterprise, Trade and InvestmentReport on the Committee's Inquiry into Barriers to the Development of Renewable Energy Production and its Associated Contribution to the Northern Ireland Economy - Volume 3Together with the Minutes of Proceedings of the Committee Ordered by The Enterprise, Trade and Investment Committee to be printed 27 January 2011 Session 2010/2011Third ReportTable of ContentsAppendix 4 – Research Papers1. Renewable Energy Workshops 2. Renewable Energy Event 3. FIT v ROC 4. Renewable Generation and Policy within selected EU Countries 5. Energy Act 2010 6. NIE Distribution Code 7. Planning and Grid Connection comparisons 8. Grid Connection 9. Governance Structures
21 May 2010 NIAR 000-10 Aidan StennettKey points from the Committee for Enterprise, Trade and Investment's Renewable Energy Workshops1 Introduction On the 18 May 2010 the Committee for Enterprise, Trade and Investment held workshops with stakeholders from the renewable energy sector in Northern Ireland. The workshops featured contributions from specialists in the fields of economics, energy, and government. The following paper provides an overview of workshop discussions, outlining the key points raised. 2 Economic Issues Discussion on the economy focused on a number of inter-related issues – competitiveness, financing, risk and uncertainty, resources, and best practice. ResourcesStakeholders acknowledged the wealth of renewable energy resources available to Northern Ireland in the form of wind, grass and ocean energy. An analogy was drawn with Saudi Arabia and other oil producing countries, suggesting that if Northern Ireland could successfully harness its renewable energy potential it could become as important to the new global energy economy as those countries are to the current fossil fuel based energy market. Some participants argued that too much emphasis (investment and policy) was placed upon on-shore wind to the detriment of other forms of energy generation. Stakeholders also highlighted the human resources available in Northern Ireland. There was recognition that the skills required to grow the renewable industry already exist (particularly research and manufacturing), but it was necessary to figure out how best to utilise those skills. On the other hand, stakeholders suggested that the region has and could continue to suffer from a brain drain due to an underdeveloped indigenous renewables market (this is dealt with in more detail below). Participants were also keen to highlight Northern Ireland's 'vibrant manufacturing' base, which they felt could provide a sound foundation for the development of the renewable energy industry. CompetitionDiscussions noted that the Northern Ireland renewable energy industry competed on two levels – globally and locally. That is, the industry is situated within and faces competition from Northern Ireland and global energy markets. Stakeholders argued that Northern Ireland was at a competitive disadvantage in the global renewable market. A common view amongst participants was that competitors outside of Northern Ireland could offer cheaper products (both technology and energy). Stakeholders noted that base costs in Northern Ireland were higher than in the regions with which it competes. Norway and Denmark were cited as examples of low-cost regions exporting to the global market. Locally it was felt that the industry faced two obstacles. Firstly, Northern Ireland's energy sector was described as monopolistic. NIE's domination of the sector and the need to introduce greater competition into the market was highlighted. Secondly, stakeholders held the view that the indigenous renewable energy market was under-developed and that growth was slow. Invest NI's policy of favouring exporting companies was criticised in this regard. It was felt that, at current levels, the market could not fully absorb the skills available within the region, resulting in a brain drain. In addition, examples of firms developing innovative technologies in Northern Ireland only to subsequently move 'across the water to sell and to set up shop' were cited. Furthermore, it was suggested that renewable energy companies operating in Northern Ireland were often foreign owned, resulting in profits going elsewhere. Localisation or "communtisation" of the industry was put forward as a solution. That is, it was suggested that a cooperative model, within which local communities owned their energy system, might assist industry growth. Risk and uncertaintyStakeholders felt that risk aversion at both government and private-sector level hindered the growth of the industry. Risk aversion was thought to be particularly prevalent in the area of industry led innovation and research and development. It was felt that investment risk could be countered by investing in a broad renewable energy mix. Uncertainty was cited as a factor in encouraging the perception of risk. The lack of an over-arching government strategy was thought to drive uncertainty in the market. It was felt that industry was reluctant to invest due to limited reassurances from government. Stakeholders argued that the immediate publication and implementation of the Strategic Energy Framework would counter some of the doubt that currently exists within the industry. FinancingThe slow development of the industry was attributed, in part, to insufficient investment and the difficulties firms encounter in raising finance. The notion that EU funding was 'too difficult' and particularly prohibitive to SMEs was raised by a number of participants. Some felt that sourcing funding was too expensive and resource intensive. The industry would like clear advice on such funding. It was suggested that this could take the form of guidelines on what is available, the criteria to be met and case studies of firms who have successfully secured EU monies. Some participants expressed dissatisfaction with what they perceived as a funding structure (at all levels of government) that appeared to favour universities. It was suggested that universities were being generally more successful in securing funding. Stakeholders, however, recognised that Grant investment should not be the only method of financing growth. Alternative suggestions included low interest loans, a renewable levy on electricity, tax incentives for research and development, and home owners buying/investing in technology on the basis of future cost savings. There was a general consensus that the current Renewable Obligation Certificate (ROC) system bred uncertainty and ensured that banks were reluctant to finance renewable projects, particularly in the current economic climate. Stakeholders argued that a Feed In Tariff would be more desirable even if the levels of support offered were lower, such a system would allow industry to predict future prices with a greater degree of accuracy. It should be noted that a counter argument was raised during these discussions, that is, the ROC system was responsible for bringing money into the Northern Ireland economy. Best PracticeThroughout the discussions a number of countries were held up as example of best practice, specifically Denmark, Germany, Norway and Scotland. Stakeholders argued that rather than attempting to 'reinvent the wheel' industry growth would be better served by copying successful growth models from elsewhere. 3 Government Discussion on the opportunities and barriers associated with government issues focused on leadership, strategy, joined-up action, European Engagement and planning. LeadershipStakeholders felt that the government could demonstrate leadership and will by 'practicing what it preaches'. It was suggested that this could be achieved by utilising renewable technologies in government buildings, with Parliament Buildings cited as the ideal place to begin this process. It was similarly felt that decisive leadership could be shown by ensuring social housing employed renewable technology and energy efficiency into its design. In addition stakeholders suggested that government procurement practices could be more supportive of the renewables sector in general and renewable SMEs in particular. Discussions tapped into a wider debate concerning what the role of government should be and what was meant by leadership. Participants suggested the existence of a 'grant culture' and agreed there was a need to move away from this. Progress would better served by a government who saw its role as facilitating industry growth. It was felt that the government should not overplay its role in sustainable energy rather it should incentivise the market, nurture it and provide it with customers without taking ownership of it. Stakeholders would like the government to clearly define its position on economic and regulatory intervention in the market place. StrategyParticipants acknowledge that the renewable energy targets set at EU and UK level were challenging. There was some concern with regard to how these could be achieved in a Northern Ireland context. As outlined above, participants were critical of the absence of a long-term renewable strategy. This, it was argued, has created a vacuum, which has been filled by uncertainty and instability. The lack of a long-term strategy was thought to be particularly problematic since the industry itself was attempting to plan 20-25 years ahead. Participants acknowledged that the introduction of the Energy Act (2008) in the rest of the UK[1] had removed this uncertainty. It was hoped that the SEF would achieve the same in Northern Ireland. Discussions also revealed that certain sectors from within the industry felt that they were insufficiently consulted during the drafting of the SEF. This concern was voiced by representatives of 'less-developed' technologies in particular. Again, participants felt this was symptomatic of the government's focus on on-shore wind. There was concern that the SEF would not adequately consider and target other technologies. This, it was suggested, could prevent the development of an efficient renewable energy mix in Northern Ireland. In a similar vein, participants expressed concern that previous strategic thinking had focussed on electricity generation whilst largely ignoring the significant contribution of heat generation. Some groups expressed the view that a macro level debate about energy cost in Northern Ireland was necessary. Joined-up actionThere was a consensus amongst participants that energy was a cross-departmental issue. They suggested, however, DETI was the only department that considered energy as a high priority. Fragmentation across government departments and agencies was also thought to cause confusion in the market place. Participants added that fragmentation led to difficulties in securing funding. Consequently, participants argued that the combination of these two factors suggested the need for greater cooperation at a departmental level. Some suggested a more radical solution in the creation of a single department with a sole remit for all energy issues. European EngagementDiscussion on Europe acknowledged the wealth of EU (e.g. €50bn R&D Budget) funding potentially accessible by companies in Northern Ireland. The role of Invest NI in calling for proposals was recognised. There was however, a suggestion that EU funding was impenetrable and difficult to understand, as a result greater guidance from government was requested. Although not explicitly stated, recognition during the discussions of the Northern Ireland Executive Office in Brussels' remit for assisting SMEs in securing funding implied that this could be an area for future exploration. PlanningA number of participants suggested that Northern Ireland's planning system was slow and over-bureaucratic, stifling growth as a result. A review of planning, with a view to streamlining and simplifying process, was suggested. 4 Energy Discussions on energy issues raised issues concerning infrastructure, public opinion, the research base and the energy mix. InfrastructureParticipants held the view that the there is a lack of infrastructure to support the level of development required. Particular focus was paid to the grid, which was thought to be underdeveloped. In addition there was a degree of criticism from groups concerning the grid on two points: that the developer pays for connections; and that government consultation on grid connection has focused on large-scale wind producers. Some participants suggested that infrastructural change could necessitate difficult choices. The government and public may be required, for example, to weigh infrastructural improvements against the aesthetic beauty of the countryside. Public opinionDiscussions focused on a perceived lack of understanding amongst the public on energy issues and the role of renewable energy. Some suggested that a significant cultural barrier to the full acceptance of renewable energy existed in Northern Ireland. Participants agreed that educating the public would assist the growth of a low carbon economy. There was, however, some debate over who would be responsible for providing this education. One suggestion was to roll-out trial projects to show-case renewable technology. Related discussions questioned whether renewables are viewed negatively by the public. Participants suggested that problems associated with delays, waste, planning and finance have resulted in a negative backlash from the community. The Rose Energy plant was cited as an example of this. The research baseThere was considerable praise of Northern Ireland's academic research base amongst groups. Participants also suggested that technological advancement had been born from necessity, one contributor referred to an Economist article which claimed that 15 renewable energy technologies had been developed globally as a result of oil rising to £150 per barrel. Participants expressed the view that future needs would continue to drive technology, for Northern Ireland to lead the way, however, the government must assist in creating a business environment conducive to innovation. As outlined above, groups expressed concern that the lack of an indigenous renewable energy market may be contributing to a brain drain and motivating innovative firms to seek markets elsewhere. The energy mixStakeholders questioned why there was an over-reliance on wind energy in Northern Ireland. Issues of intermittency and energy storage were raised by some. It was suggested that the focus on wind power was understandable since the technology was at a later stage of development and because 'wind power was the easiest to harness'. In general, groups were supportive of a varied energy mix. Two arguments in favour of this were raised. On the one hand it would ensure sustainability, accounting for occasion of no wind for example. On the other hand it would allow investors from the private and public sector to spread risk. In a related point, some suggested that technological solutions to energy production should only be viewed as part of the solution. To some, ensuring energy efficiency was an important initial step. [1] It should be noted that while the Energy Act extends to the whole of the UK a large proportion of its provisions do not extend to Northern Ireland.
14 June 2010 Aidan StennettCommittee for Enterprise, Trade and Investment – Renewable Energy EventNIAR 248-10Paper providing details of Committee for Enterprise, Trade and Investment renewable energy event including content of workshop discussions as well as additional information. Paper 248/1014 June 2010Research and Library Service briefings are compiled for the benefit of MLA's and their support staff. Authors are available to discuss the contents of these papers with Members and their staff but cannot advise members of the general public. We do, however, welcome written evidence that relate to our papers and these should be sent to the Research & Library Service, Northern Ireland Assembly, Room 139, Parliament Buildings, Belfast BT4 3XX or e-mailed to RLS@niassembly.gov.uk Executive SummaryOpening remarksDuring the event's opening speeches delegates were briefed on ocean energy, renewable energy in Northern Ireland and European Union perspectives. Ocean Energy: three sources of ocean energy were identified – wave energy, offshore wind and tidal current flow. In all three cases the resource potential is estimated to equal or exceed the resources available elsewhere in Europe. It was estimated that exploitation of ocean energy could feasibly produce a net present value to the economies of Northern Ireland and the Republic of Ireland of €9bn by 2030. Renewable energy in Northern Ireland: delegates were briefed on the environmental, social and economic role renewable energy plays. Opportunities for SMEs were identified in: developing new technologies and services; business diversification; exporting knowledge; and the availability of research and development skill that could attract inward investment. Barriers were identified in: investor fixation on payback periods; the availability of finance; shortage of suitably skilled workers; lack of long term policy direction; lack of information for consumers; and the gap between strategic and operative actions. The future development of the industry was thought to depend on: customer education; developing engagement with European partners; and establishing links between government and industry. European Union: delegates were briefed on the European context to industry development. A bleak picture of current economic context was painted but the speaker was optimistic that the EU could emerge from crisis stronger through collective action. Key elements of the 'resource efficient Europe' theme of the Europe 2020 strategy were outlined. These included: mobilisation of financial instruments; encouraging market-based instruments; decarbonisation of the transport sector; the formation of a European supergrid; and a revised Energy Efficiency Action Plan. WorkshopsThe workshops focused on three areas – economy, government and energy. The main areas of discussion under each heading were:
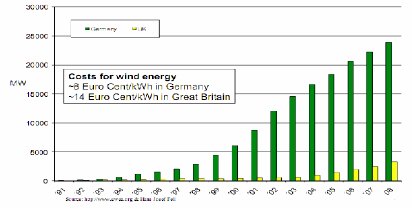
The following is summary of the key points raised under each sub-heading, additional background information is included where appropriate. EconomyCompetition – delegates noted that the renewable energy industry had to compete both locally and globally. They argued that NI was at a competitive advantage globally and that the renewable energy market was underdeveloped globally. Additional Information – to contextualise the level of competition within Europe it is useful to examine the internal and external development of Europe's 'big hitters'. Denmark: has 'developed a world class turbine industry and has had one of the most aggressive energy efficiency programmes in the EU'. In 1991 92% of the regions energy was produced from oil. By 2006 this had declined to 54% with wind and biomass generation increasing significantly. As an exporter Denmark exports the highest promotion of energy technologies and equipment relative to total national goods exports in EU-15 (2006). Germany: As of 2006, 21GWs of wind power was installed in the region. By the same period Germany was producing 3.6m tonnes of biodiesel which equates to 30% of global supply. The growth of Germany's renewable industry has been attributed to, in part, the adoption of a feed-in-tariff. Biofuel production has also benefitted from tax exemptions. As early as 2002, Germany's renewable technology exports accounted for 20% and 10% of its wind and solar production respectively. Resources – delegates highlighted the wealth of renewable energy resources available in Northern Ireland, as well as the significant human resource available. Some, however, felt too much emphasis had been placed on onshore wind energy to the detriment of other forms of energy. Additional InformationEnergy resource: A 2004 study by Action Renewables into Northern Ireland's renewable energy resource estimated that total feasible renewable energy resource in the region was 1133MW of installed electrical generation capacity, providing 4,113GWh per annum. This majority resource was expected to be sourced from wind energy – onshore wind (565MW), offshore wind (500MW – nominal with further exploration required). The viable tidal energy resource available to Northern Ireland has been calculated at 530GWH/yr. DETI's draft Strategic Energy Framework (SEF) outlines five scenarios for wind generation in 2020:
Human resource: Oxford Economics has calculated two scenarios for Northern Ireland job creation going forward to 2020 – a baseline scenario of 5,000 per annum and an apsiprational scenario of 7,300 per annum. In both cases they estimate jobs in the utilities sector to increase by 200 per annum. They predict, that to meet demands in the baseline scenario, it would require 7.3% increase in engineering and technology graduates. This increases to 8.1% under the aspirational scenario. Oxford Economics expressed concern, however, that 'even under the baseline forecast there would be a shortfall in subject areas such as mathematical & computer sciences, engineering &technology, law and creative art & design graduates'. To this they add: 'perhaps the emergence of 'green jobs', the reshaping of the financial and professional services sector and a more developed tourist industry will alter the shape of the skills mix and a different aspirational path may emerge'. The Oxford Economics report also notes that currently many jobs requiring STEM subjects were located in the England's Greater South East. Risk and uncertainty – delegates stated that both government and industry were risk adverse. Uncertainty, it was argued, had encouraged this aversion. The lack of a coherent government strategy was thought to be key. Additional Information – Results of the 2007 UK Innovation Survey found that Northern Ireland had the second lowest rate of business innovation of all UK regions during the period 2004 to 2006. Cost was the most often cited reason for not partaking in innovation. Other reasons included lack of knowledge and market factors. Financing – delegates argued that EU funding was too difficult to access and that alternatives to grant funding should be explored; that the Renewable Obligation Certificates (ROCs) bred uncertainty and Feed-in-Tariffs should be pursued. Additional Information – the current value of £45 is based on a buy out fee (£37.19) plus anticipated buy out fee redistribution per ROC. The Department has stated that Northern Ireland does not currently have the legislative powers to introduce a feed-in tariff. Best Practice – Denmark, Germany Norway and Scotland were put forward as regions that Northern Ireland should emulate – space does not permit a full analysis of these regions, a separate research paper on best practice may be useful going forward. GovernmentLeadership – delegates argued that the government should lead the way by introducing renewable generation in public sector buildings and social housing. They also stated that more could be done to encourage renewable sector SMEs to become involved in the procurement process. Additional Information – the Carbon Trust has estimated that the public sector accounts for 5% of Northern Ireland's total energy use and approximately 70,000 tonnes of carbon dioxide annually. They estimate that 20% of its energy use could be saved by an investment of £120-180 million on basic measures with a payback of 4-6 years. This would result in recurring cost savings of £30 million per annum. Strategy – delegates acknowledged challenging targets at EU, UK and NI level but were again critical of the absence of a long-term NI strategy. They were also critical of what they saw as a lack of direction on renewable heat generation. Additional Information – EU aims to ensure 20% of total energy production is from renewables by 2020. The UK has a 2020 target of 15% renewable energy contribution to total energy demand – made up of 30% electricity production, 12% heat generation and 10% transport. The draft SEF suggests a Northern Ireland target of 40% electricity generation and 10% heat. As of 8 June 2010, the final SEF remains unpublished. Minister statements suggest it will be available in four to six weeks. The draft SEF states that DETI has no statutory powers to allow it to work in the area of renewable heat. The Energy Act 2008 provides the statutory powers for a renewable heat incentive scheme to be introduced across England, Wales and Scotland. Join-up action – delegates felt that interdepartmental action was insufficient and argued for a single body/department with soul responsibility for energy matters. Additional Information – the draft SEF refers to the establishment of an Interdepartmental Working Group on Sustainable Energy that would develop a report on joined-up action. To date no such report has been produced. European Engagement – delegates noted that substantial EU funding was available for R&D but argued that EU funding was impenetrable and difficult to understand. Additional Information – further information on EU issues will provided to the Committee as part of a substantive paper on EU engagement and the European Commission Work Programme 2010. Planning – the planning system was regarded as slow and over-bureaucratic. Additional Information – the Northern Ireland Audit Office's review of Planning Service performance found that the agency had: consistently failed to meet targets; had taken significantly longer than planned to implement PPS agreements; cost per planning application increased by 59% from 2004-05 to 2008-09; and the number of decisions per planner has fallen by 19 per cent in the last two years. EnergyInfrastructure – the grid was deemed to be underdeveloped. It was also felt that consultation on grid improvements had focussed on the opinions of wind producers to the detriment of others. There was also criticism on the developer pays model. Additional Information – EriGrid estimate that to ensure the Single Electricity Market grid is fit for use will require investment of approximately €4bn. Public opinion – delegates argued that there was a lack of understanding amongst the public on energy issues and the role of renewable energy in the future energy mix. They also felt that renewables had developed a bad image. Additional Information – a Department of Energy and Climate Change (DECC) (2009) survey found that only 3% of the public sample professed to not recognising any form of renewable energy. An earlier survey (2003) found that out all regions in the UK, Northern Ireland had the highest level of total awareness of renewables. It also found that Northern Ireland had the highest number of respondents who thought renewables were a good idea, that they were preferable to fossil fuels, and would stongly agree with a clean renewable energy generating site built in their area. The research base – Northern Ireland's research base was praised and delegates expressed the view that future needs would continue to drive technological development. Additional Information – issues regarding the research base are addressed in the skills section above. Energy Mix – some delegates felt that there had been an over-emphasis on the role and development of wind technologies. Groups were supportive of a varied renewable energy mix. Delegates also felt that energy generation through renewables was only part of the solution arguing for increased energy efficiency development. Additional Information – onshore wind forms a major part of energy generation in 2020 in all five scenarios outlined in the Draft SEF. It is second only to fossil fuels. The reliance on onshore wind is perhaps pragmatic as it is 'the most economically and technically advanced of all renewables, able to compete in cost with other conventional generation and deliver on a large scale'. Contents1 Introduction 2 Opening remarks 2.1 Sustainable Energy Authority of Ireland: Marine Renewables – a development opportunity for Ireland 2.2 Action Renewables: Renewable Energy in Northern Ireland 2.3 European Commission Office in Northern Ireland 3 Economic Issues 3.1 Competitiveness 3.2 Resources 3.3 Risk and uncertainty 3.4 Financing 3.5 Best Practice 4 Government Issues 4.1 Leadership 4.2 Strategy 4.3 Joined-up action 4.4 European Engagement 4.5 Planning 5 Energy 5.1 Infrastructure 5.2 Public opinion 5.3 The research base 5.4 The energy mix IntroductionThe following paper provides further information on the Committee for Enterprise, Trade and Investment's renewable energy workshops held on the 18 May 2010. It supplements the previous briefing (NIAR241) by presenting a summary of delegate comments alongside other information (where appropriate) in order to place delegate statements into context. The paper begins by providing a brief overview of the event's opening speeches. Opening remarksPrior to the workshops, delegates received briefings from a number of specialists: Eoin Sweeny of Sustainable Energy Authority of Ireland; Michael Doran of Action Renewables; Maurice Maxwell of the European Commission Office in Northern Ireland; and Richard Hogg of Limavady Gear Company Ltd. The following section provides an overview of these opening remarks. Regrettably, it has not been possible to secure a copy of Richard Hogg's speech and as such it is absent from the overview. 2.1 Sustainable Energy Authority of Ireland: Marine Renewables – a development opportunity for Ireland Eoin Sweeny, from the Ocean Development Unit of the Sustainable Energy Authority Ireland, briefed delegates on availability of and opportunity presented by Ocean Energy in the waters surrounding the Island of Ireland. Ocean Energy offers three separate opportunities for development: wave energy, most prevalent off the west coast; tidal current flow, concentrated in the North East and Irish sea; and offshore wind, available around all of island. In all three cases the Island of Ireland had an estimated resource to rival or in cases exceed that available to the rest of Europe.[1] Significantly the presentation, drawing on a previous economic study, noted that: There is currently sound quantitative evidence that a fully developed island of Ireland Ocean Energy sector providing a home market and feeding a global market for renewable energy could by 2030 produce a total net present value of up to €9 billion to the Irish and Northern Irish economies.[2] Further to this it was noted that despite a degree of uncertainty surrounding the factors determining success it was thought that there was 'good precedent for a belief that Ocean Energy will delver on its promise: the technology development and cost reductions of onshore wind and electricity generating gas turbines being prime examples of this'.[3] 2.2 Action Renewables: Renewable Energy in Northern Ireland Michael Doran, Director of Action Renewables Northern Ireland, presented delegates with information on: the role of renewable energy; the opportunities and barriers for SMEs in the renewable energy industry in Northern Ireland; factors influencing the renewable energy industry; the role of government; and the future of the renewable industry. Renewable energy's role was thought to be threefold: environmental, tackling climate change; societal, ensuring energy security; and economic, assisting in energy price stability and job creation. Opportunities for SMEs were identified in: developing new technologies and services; business diversification; exporting knowledge; and the availability of research and development skill that could attract inward investment.
Looking to the future, developing Northern Ireland's renewable industry was a task that required:
2.3 European Commission Office in Northern Ireland Maurice Maxwell of the European Commission Office in Northern Ireland provided a European Context to renewable development. He began by painting a bleak picture of the current economic context – unemployment, sluggish structural growth and excessive levels of debt – but was optimistic that the EU could exit the crisis stronger if collective action was taken to create a 'smart, sustainable and inclusive economy delivering high levels of employment, productivity and social cohesion'. Delegates were briefed on the Europe 2020 strategy. Key elements under the strategy's 'resource efficient Europe' theme include:
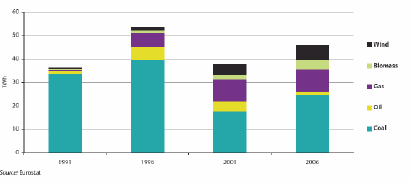
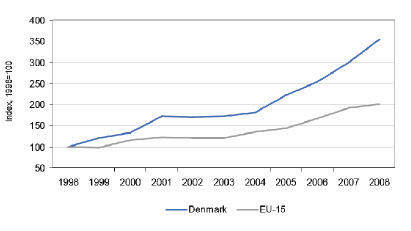
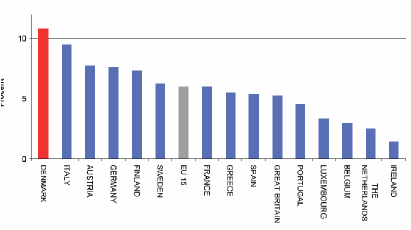
Economic IssuesDelegate discussions on the economy examined a number of inter-related issues – competitiveness, financing, risk and uncertainty, resources and best practice. 3.1 Competitiveness What delegates saidDiscussions noted that the Northern Ireland renewable energy industry competed on two levels – globally and locally. That is, the industry is situated within and faces competition from Northern Ireland and global energy markets. Stakeholders argued that Northern Ireland was at a competitive disadvantage in the global renewable market. A common view amongst participants was that competitors outside of Northern Ireland could offer cheaper products (both technology and energy). Locally it was felt that the industry faced two obstacles. Firstly, Northern Ireland's energy sector was described as monopolistic. NIE's domination of the sector and the need to introduce greater competition into the market was highlighted. Secondly, stakeholders held the view that the indigenous renewable energy market was under-developed and that growth was slow. Invest NI's policy of favouring exporting companies was criticised in this regard. It was felt that, at current levels, the market could not fully absorb the skills available within the region, resulting in a brain drain. In addition, examples of firms developing innovative technologies in Northern Ireland only to subsequently move 'across the water to sell and to set up shop' were cited. Furthermore, it was suggested that renewable energy companies operating in Northern Ireland were often foreign owned, resulting in profits going elsewhere. Localisation or "communitisation" of the industry was put forward as a solution. That is, it was suggested that a cooperative model, within which local communities owned their energy system, might assist industry growth. CommentaryThe European Union publication 'Panorama of energy' (2009) is useful for placing the above comments into context as it provides an insight into the renewable energy industries of other EU countries, countries with which Northern Ireland would hope to compete. It is worth examining a number of regions in greater detail to provide a better understanding of their various stages of renewables development. For the purposes of this paper discussion is confined to the often cited European 'big hitters' – Denmark and Germany – a more complete analysis of EU countries, using the panorama as a starting point may be worthwhile in going forward. Denmark, according to the study, has 'developed a world class turbine industry and has had one of the most aggressive energy efficiency programmes in the EU' as such it is defined as a 'low energy intensity' and 'low carbon intensity' economy.[4] Looking at energy generation, in 1991 92% of the region's energy came from coal; by 2006 this had declined to 54%. Energy production from oil has also declined in the same period. Coal and oil production has declined as wind and gas have entered into the system (as of 2007 wind accounted for just over 15% of domestic energy supply[5]).[6] Increased use of biomass has also led to a decline in fossil fuel reliance. Figure 1 demonstrates the changes in Denmark's electricity production between 1991 and 2006. Energy efficiency has also been significant. Between 1980 and 2006 the Danish economy grew by approximately 50%; in the same period energy consumption has remained almost static.[7] As an exporter Denmark holds 'a leading position among the EU-15 for exports of energy technologies relative to total national goods exports'. Figures 3 and 4 below demonstrate this explicitly (note Figure 3 represents energy exports as a percentage of total exports, as opposed to total national exports). The largest proportion of Danish energy exports (technology and equipment) go to Germany (17%), followed by the UK and the USA. These three markets account for 40% of the region's total energy and equipment exports.[8] Denmark's successes in developing its renewable energy industry both internally and externally should be placed in context however. Denmark is the only net exporter of energy in the EU (as of 2009), largely due to oil and gas resources in the North Sea. Furthermore, the region has 'some of the highest energy and environmental taxes and levies in the EU'.[9] Figure 1: Denmark gross electric power generation by source[10]
Figure 2: Exports of energy technologies and equipment
Figure 3: Exports of Energy Technologies and Equipment relative to Total National Goods Exports
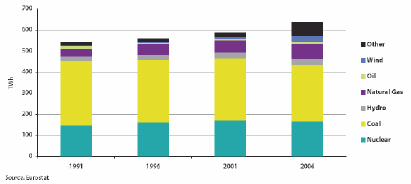
Germany in the first ten years of the twentieth first century Germany emerged as a world leader in renewable energy, particular in the development and exploitation of wind and biodiesel. As of 2006, 21GWs of wind power was installed in the region. By the same period Germany was producing 3.6m tonnes of biodiesel, 30% of global supply. According to the EU, the region is 'expected to easily surpass its target under the existing Directive (2001/77/EC) for renewable electricity of 12.5% in 2010'. The country had already reached 12% by 2006. Germany has set a target of 18% of final energy consumption from renewables by 2020 and has made a commitment to produce 25-30% of electricity from renewable sources by the same year.[11] Figure 4 provides an overview of German electricity production between 1991 and 2006. It is notable that despite the growth in wind generation the country, in 2006, still relied on coal considerably, with nuclear energy making up a significant proportion of electricity production. The growth of Germany's renewable industry has been attributed to, in part, the adoption of a feed-in-tariff. Biofuel production has also benefitted from tax exemptions.[12] Recent data on German renewable technology exports is difficult to locate. However, it is evident that as early as 2002 Germany's renewable technology exports accounted for 20% and 10% of its wind and solar production respectively. By the same period the country's renewable technology exports were estimated to value €350m, or around 10% of domestic production.[13] Figure 4: Germany gross electric power generation by source
3.2 Resources What delegates saidStakeholders acknowledged the wealth of renewable energy resources available to Northern Ireland in the form of wind, grass and ocean energy. An analogy was drawn with Saudi Arabia and other oil producing countries, suggesting that if Northern Ireland could successfully harness its renewable energy potential it could become as important to the new global energy economy as those countries are to the current fossil fuel based energy market. Some participants argued that too much emphasis (investment and policy) was placed upon on-shore wind to the detriment of other forms of renewable energy generation. Stakeholders also highlighted the human resources available in Northern Ireland. There was recognition that the skills required to grow the renewable industry already exist (particularly research and manufacturing), but it was necessary to figure out how best to utilise those skills. On the other hand, stakeholders suggested that the region has and could continue to suffer from a brain drain due to an underdeveloped indigenous renewables market (this is dealt with in more detail below). Participants were also keen to highlight Northern Ireland's 'vibrant manufacturing' base, which they felt could provide a sound foundation for the development of the renewable energy industry. CommentaryResourcesAgain, to put delegate statements in context it is worth examining Northern Ireland's theoretical resource in more detail. A 2004 study by Action Renewables into Northern Ireland's renewable energy resource noted that total installed fossil fuel capacity in Northern Ireland was 1400MW, while electricity demand was approximately 8150GWh per annum of which 3% was provided by renewables.[14] The same report estimated that total feasible renewable energy resource in the region was 1133MW of installed electrical generation capacity, providing 4,113GWh per annum. This majority resource was expected to be sourced from wind energy – onshore wind (565MW), offshore wind (500MW, nominal with further exploration required).[15] Table 1, below, provides a breakdown of findings from the Action Renewables study. The table suggests that after wind the next largest potential sources of energy are landfill gas (23.7MW capacity producing 177GWh per annum) and Municipal Solid Waste (MSW) (13MW capacity producing (111GWh per annum).[16] Tidal stream energy has not been included in the figures. The Sustainable Energy Ireland study Tidal and Current Energy Resources in Ireland (2004), estimates that waters around the Island of Ireland contain a theoretical tidal resource of 230TWH/yr. The same report, however, calculates the viable resource as 915GWH/yr. Northern Ireland's viable resource is calculated as 530GWH/yr (57% of the total viable resource in Irish waters). Northern Ireland's viable resource was found to be spread across four sites: the North East Coast (273GWH/yr), Strangford Lough (130GWH/yr), Copeland Island (125GWH/yr) and Lough Foyle (2GWH/yr).[17] The figures for on shore wind contained in Table 1 are considerably less ambitious than those contained in DETI's Draft Energy Strategy. The strategy outlines five renewable electricity generation scenarios for 2020 – 30%, 33%, 37%, 42% and 49%. The corresponding levels of wind generation for each scenario are as follows:
Scenario 3 has a lower installed wind capacity as it envisages 300MW of installed tidal stream energy (other scenarios target 50MW tidal stream), whereas Scenario 5 envisages 300MW of installed large-scale biomass generation (see Table 2 for further details).[18] Table1: Summary of the feasible renewable electricity resource in Northern Ireland by county[19]
Table 2: Northern Ireland Energy Mix Scenarios 2020[20]
Human resourceIn response to the UK Government's consultation on its UK Renewable Energy Strategy (2008), Energy and Utilities Skills, the Skills Sector Council for the gas, power, waste management and water industries stated: Critical to delivering the 2020 energy target will be getting the right skills, in the right places, at the right time and in the right quantities. Energy & Utility Skills - The Sector Skills Council for the electricity, gas, waste management and water industries, UK Renewable Energy Strategy Consultation Response They added, however, that uncertainty over future demand, particularly in the area of emerging technologies, presented a 'complex challenge'. To assist with this complexity the organisation recommended the government promote:
A 2009 Oxford Economics report for the Department for Employment and Learning on Northern Ireland identified the following strengths and weaknesses in Northern Ireland's skills base. Strengths:
Weaknesses:
The report noted that many jobs requiring high-level management qualifications or STEM subjects were located in the England's Greater South East. A headline figure illustrates the scale of Northern Ireland's difference with the UK average; that is, if Northern Ireland had sector concentrations equivalent to the UK average, there would be 4,000 more STEM degree holders in work.[24] The report forecasts, under a baseline scenario, job creation of 5,000 jobs per annum between 2008 and 2020. Under an aspirational scenario this would increase to 7,300 per annum. In both scenarios job creation in the utilities sector is predicted to be 200 per annum. To meet the demands of the baseline would require a 7.3% increase in engineering and technology graduates. Under the aspirational scenario, an 8.1% increase would be required. The report notes that the energy sector is a particularly STEM 'hungry' sector.[25] In 2008/09 a total of 660 Northern Ireland domiciled students gained an engineering and/or technology degree at a UK higher education institution. Of these, 105 were postgraduate degrees, 30 of which were doctorates. Of those gaining undergraduate degrees, 100 qualified with first class honours and 200 second class-upper division.[26] Oxford Economics' ultimate conclusion, however, is that 'even under the baseline forecast there would be a shortfall in subject areas such as mathematical & computer sciences, engineering & technology, law and creative art & design graduates'. To this it adds: Perhaps the emergence of 'green jobs', the reshaping of the financial and professional services sector and a more developed tourist industry will alter the shape of the skills mix and a different aspirational path may emerge.[27] 3.3 Risk and uncertainty What delegates saidStakeholders felt that risk aversion at both government and private-sector level hindered the growth of the industry. Risk aversion was thought to be particularly prevalent in the area of industry-led innovation and research and development. It was felt that investment risk could be countered by investing in a broad renewable energy mix. Uncertainty was cited as a factor in encouraging the perception of risk. The lack of an over-arching government strategy was thought to drive uncertainty in the market. It was felt that industry was reluctant to invest due to limited reassurances from government. Stakeholders argued that the immediate publication and implementation of the Strategic Energy Framework would counter some of the doubt that currently exists within the industry. CommentaryInnovationResults of the UK 2007 UK Innovation Survey found that Northern Ireland had the second lowest rate business innovation of all UK regions during the period 2004 to 2006. During this period 57% of all Northern Ireland enterprises were innovation active, compared to 69% in Eastern England the region with the highest proportion of innovative enterprises. In Northern Ireland, large enterprises were more likely to be innovative that SMEs. Cost was the most often cited reason for not partaking in innovation. Other reasons included lack of knowledge and market factors. StrategyFor commentary on strategy development please see section on Government issues below. 3.4 Financing What delegates saidThe slow development of the industry was attributed, in part, to insufficient investment and the difficulties firms encounter in raising finance. The notion that EU funding was 'too difficult' and particularly prohibitive to SMEs was raised by a number of participants. Some felt that sourcing funding was too expensive and resource intensive. The industry would like clear advice on such funding. It was suggested that this could take the form of guidelines on what is available, the criteria to be met and case studies of firms who have successfully secured EU monies. Some participants expressed dissatisfaction with what they perceived as a funding structure (at all levels of government) that appeared to favour universities. It was suggested that universities were being generally more successful in securing funding. Stakeholders, however, recognised that Grant investment should not be the only method of financing growth. Alternative suggestions included low interest loans, a renewable levy on electricity, tax incentives for research and development, and home owners buying/investing in technology on the basis of future cost savings. There was a general consensus that the current Renewable Obligation Certificate (ROC) system bred uncertainty and ensured that banks were reluctant to finance renewable projects, particularly in the current economic climate. Stakeholders argued that a Feed In Tariff would be more desirable even if the levels of support offered were lower, such a system would allow industry to predict future prices with a greater degree of accuracy. It should be noted that a counter argument was raised during these discussions, that is, the ROC system was responsible for bringing money into the Northern Ireland economy. CommentaryRenewable Obligation CertificateThe Northern Ireland Renewable Obligation (NIRO) is the main mechanism DETI employ to encourage renewables development. NIRO places a legal requirement on all licensed electricity suppliers to provide evidence to Ofgem that a specified proportion of the energy they supply to consumers contains has been generated using renewable sources. Ofgem issues suppliers meeting these requirements with a certificate – ROC – for every MWh of eligible renewable generation. NIRO also allows ROCs to be used as evidence of compliance. ROCs can be openly traded. Alternatively suppliers are permitted to pay a buy out fee to Ofgem for each MWh of the specified quantity that is not covered by presenting ROCs; the buy out fee for 2009/10 is £37.19 per MWh. At the end of each obligation period proceeds from buy-outs are redistributed amongst suppliers in proportion to the number of ROCs they produced. A ROCs Market value (approximately £45) is equal to the buy out fee plus anticipated buy out fee redistribution per rock.[28] Feed-in-TariffAs mentioned earlier the EU has, in part, attributed the utilisation FIT for the development of renewable technology in Germany. The 2008 Energy Act saw FITs introduced to parts of the UK (not Northern Ireland) for micro-generation. Under the UK system a household using 4,500KWH of electricity per annum that installed 2.5KW of solar PV panels would receive the following the FIT:
As outlined above, delegates were keen to see a FIT introduced in Northern Ireland. In February 2010, when announcing changes to the ROC system, the Department stated: Northern Ireland does not currently have the legislative powers to introduce a feed-in tariff. That is why DETI has proposed to amend the NIRO to provide increased support for NI small-scale generation under the NIRO to replicate, so far as possible in NI the support levels being proposed under the FIT. 3.5 Best Practice What delegates saidThroughout the discussions a number of countries were held up as examples of best practice, specifically Denmark, Germany, Norway and Scotland. Stakeholders argued that rather than attempting to 'reinvent the wheel' industry growth would be better served by copying successful growth models from elsewhere. CommentarySpace does not permit a useful analysis of each region's renewable strategy (although some information on Denmark and Germany is provided above) - a separate paper on this topic is likely to be worthwhile going forward. Government IssuesDiscussion on the opportunities and barriers associated with government issues focused on leadership, strategy, joined-up action, European Engagement and planning. 4.1 Leadership What delegates saidStakeholders felt that the government could demonstrate leadership and will by 'practicing what it preaches'. It was suggested that this could be achieved by utilising renewable technologies in government buildings, with Parliament Buildings cited as the ideal place to begin this process. It was similarly felt that decisive leadership could be shown by ensuring social housing employed renewable technology and energy efficiency into its design. In addition stakeholders suggested that government procurement practices could be more supportive of the renewables sector in general and renewable SMEs in particular. Discussions tapped into a wider debate concerning what the role of government should be and what was meant by leadership. Participants suggested the existence of a 'grant culture' and agreed there was a need to move away from this. Progress would better be served by a government who saw its role as facilitating industry growth. It was felt that the government should not overplay its role in sustainable energy rather it should incentivise the market, nurture it and provide it with customers without taking ownership of it. Stakeholders would like the government to clearly define its position on economic and regulatory intervention in the market place. CommentaryThe 'Green New Deal for Northern Ireland' drawing a Carbon Trust study states that: Northern Ireland's public sector organisations (including local authorities, healthcare trusts and universities) account for over 5% of NI's total energy use and around 700,000 tonnes of carbon dioxide annually. Total annual expenditure on energy from imported fossil fuels is around £130 million.[30] It has estimated that: 20% of its (public sector) energy use could be saved by an investment of £120-180 million on basic measures with a payback of 4-6 years giving recurring cost savings of £30 million per annum.[31] 4.2 Strategy What delegates saidParticipants acknowledge that the renewable energy targets set at EU and UK level were challenging. There was some concern with regard to how these could be achieved in a Northern Ireland context. As outlined above, participants were critical of the absence of a long-term renewable strategy. This, it was argued, has created a vacuum, which has been filled by uncertainty and instability. The lack of a long-term strategy was thought to be particularly problematic since the industry itself was attempting to plan 20-25 years ahead. Participants acknowledged that the introduction of the Energy Act (2008) in the rest of the UK[32] had removed this uncertainty. It was hoped that the SEF would achieve the same in Northern Ireland. Discussions also revealed that certain sectors from within the industry felt that they were insufficiently consulted during the drafting of the SEF. This concern was voiced by representatives of 'less-developed' technologies in particular. Again, participants felt this was symptomatic of the government's focus on on-shore wind. There was concern that the SEF would not adequately consider and target other technologies. This, it was suggested, could prevent the development of an efficient renewable energy mix in Northern Ireland. In a similar vein, participants expressed concern that previous strategic thinking had focussed on electricity generation whilst largely ignoring the significant contribution of heat generation. Some groups expressed the view that a macro level debate about energy cost in Northern Ireland was necessary. CommentaryTargetsThe EU Renewable Roadmap outlining its long-term renewables strategy called for a mandatory target of 20% share of renewables in the energy mix by 2020. The target was endorsed by EU leaders in 2007. The target called for a focus on three areas – electricity generation, biofuels, and heating and cooling systems.[33] The previous UK government had initial aspired to follow this 20% target, but backtracked. In 2007 the then Energy Minister stated: We're negotiating with the European commission, but it's got to be a considerable figure…It's got to be somewhere between 10% and 15%. The rationale behind this retraction was that the EU directive did not specify that member states had to meet the 20% target so long as it was met across Europe as a whole.[34] As such, the UK Renewable Strategy 2009 was predicated on a 15% renewable energy contribution to total energy demand by 2020. This overarching figure is to be achieved through:
Progress on the Strategic Energy FrameworkThe Draft Strategic Energy Framework (SEF) consultation began in July 2009 and ended in September of the same year. As recently as 8 June 2010 the final strategy remained unpublished. On that date the Minister stated: I am pleased to report that the Department received some 70 responses to the consultation on the strategic energy framework. Officials have carried out a detailed analysis of the responses, which has been helpful to me and will be useful in shaping the final document. I aim to have the final version of the SEF to the Executive in the next four to six weeks and, in any event, before the summer recess.[37] Heat generationThe Draft SEF has the following to say on the issue of renewable heat: Currently DETI has no statutory powers to allow it to work in the area of renewable heat – the Department's powers limit it to electricity and gas. DETI will therefore ask the Executive and the Northern Ireland Assembly for the statutory powers necessary to take this important area of work forward.[38] The Energy Act 2008 provides the statutory powers for a renewable heat incentive scheme to be introduced across England, Wales and Scotland.[39] 4.3 Joined-up action What delegates saidThere was a consensus amongst participants that energy was a cross-departmental issue. They suggested, however, DETI was the only department that considered energy as a high priority. Fragmentation across government departments and agencies was also thought to cause confusion in the market place. Participants added that fragmentation led to difficulties in securing funding. Consequently, participants argued that the combination of these two factors suggested the need for greater cooperation at a departmental level. Some suggested a more radical solution in the creation of a single department with a sole remit for all energy issues. CommentaryJoined-up action is a feature of the Draft Strategic Energy Framework. The draft document states that the: …establishment of an Interdepartmental Working Group on Sustainable Energy November 2008, will ensure a more coordinated approach across Government to the promotion of sustainable energy, including energy efficiency and renewable energy.[40] It notes too, that a key challenge of this group is to 'develop a report of recommendations in respect of coordinated sustainable energy by the end of this year, including appropriate structure(s) to continue joined up delivery'.[41] To date the working group has not produced a report. 4.4 European Engagement What delegates saidDiscussion on Europe acknowledged the wealth of EU (e.g. €50bn R&D Budget) funding potentially accessible by companies in Northern Ireland. The role of Invest NI in calling for proposals was recognised. There was however, a suggestion that EU funding was impenetrable and difficult to understand. As a result greater guidance from government was requested. Although not explicitly stated, recognition during the discussions of the Northern Ireland Executive Office in Brussels' remit for assisting SMEs in securing funding implied that this could be an area for future exploration. CommentaryFurther information on EU issues will provided to the Committee as part of a substantive paper on EU engagement. This paper will scrutinise sections of the European Commissions Work Programme 2010 relevant to the work of the ETI Committee, including energy. 4.5 Planning What delegates saidA number of participants suggested that Northern Ireland's planning system was slow and over-bureaucratic, stifling growth as a result. A review of planning, with a view to streamlining and simplifying the process, was suggested. CommentaryThe Northern Ireland Audit Office's report on Planning Service Performance (2009) found that:
EnergyDiscussions on energy issues raised issues concerning infrastructure, public opinion, the research base and the energy mix. 5.1 Infrastructure What delegates saidParticipants held the view that the there is a lack of infrastructure to support the level of development required. Particular focus was paid to the grid, which was thought to be underdeveloped. In addition there was a degree of criticism from groups concerning the grid on two points: that the developer pays for connections; and that government consultation on grid connection has focused on large-scale wind producers. Some participants suggested that infrastructural change could necessitate difficult choices. The government and public may be required, for example, to weigh infrastructural improvements against the aesthetic beauty of the countryside. CommentaryGrid 25 sets out EirGrid's all-island grid upgrade strategy for 2008-2025. On the grid EirGrid has stated: Capacity has remained largely unchanged in the last 20 years, a period that has seen a growth of 150% in the electricity demand being carried by the system… to facilitate the necessary increase in renewable generation and to adequately meet the demands of the electricity customer, the capacity of the bulk transmission system will need to be doubled by 2025.[43] The body estimate that to ensure the SEM grid is fit for use will require investment of approximately €4bn. Such levels of investment would:
5.2 Public opinion What delegates saidDiscussions focused on a perceived lack of understanding amongst the public on energy issues and the role of renewable energy. Some suggested that a significant cultural barrier to the full acceptance of renewable energy existed in Northern Ireland. Participants agreed that educating the public would assist the growth of a low carbon economy. There was, however, some debate over who would be responsible for providing this education. One suggestion was to roll-out trial projects to show-case renewable technology. Related discussions questioned whether renewables are viewed negatively by the public. Participants suggested that problems associated with delays, waste, planning and finance have resulted in a negative backlash from the community. The Rose Energy plant was cited as an example of this. CommentaryIn a 2009, a Department of Energy and Climate Change (DECC) survey into public awareness and attitudes to renewable energy in GB, found that only 3% of the sample professed to not recognising any form of renewable energy. Survey results for individual technology types where as follows:
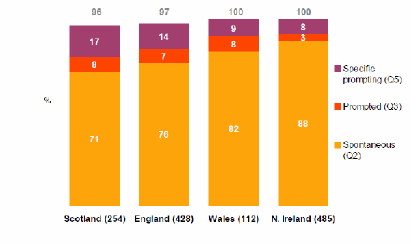
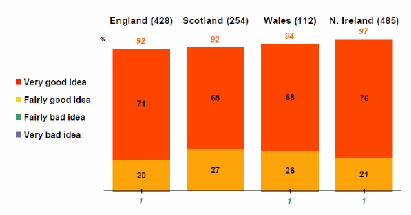
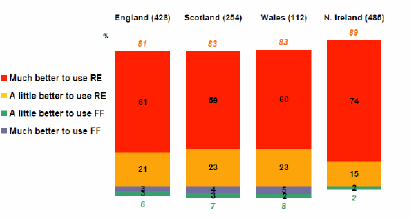
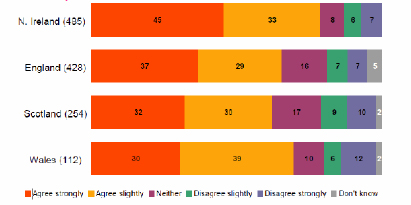
The same survey found the 60% of respondents strongly supported the use of renewables, while a further 25% slightly agreed.[45] "Attitudes and Knowledge of Renewable Energy amongst the General Public", published by the Central Office of Information in 2003 provides similar information for the UK as a whole. The report found that total awareness of renewable energy source was higher in Northern Ireland than other regions of the UK, see Figure 5 below. Northern Ireland also had the highest proportion of respondents who thought renewable energy was a 'very good idea' (see Figure 6). Similarly, a higher proportion of Northern Ireland respondents believed that renewable energy was preferable to fossil fuels (see Figure 7). Finally, Northern Ireland had the highest proportion of respondents who would 'strongly agree' with having a renewable energy generating built in their local area (see Figure 8).[46] Figure 5: Total awareness of renewable energy sources
Figure 6: Personal opinion of renewable energy
Figure 7: Personal opinion of renewable energy compared to fossil fuels
Figure 8: Personal opinion of renewable energy - "I'd be happy to have a 'clean' renewable energy generating station built in my local area"
5.3 The research base What delegates saidThere was considerable praise of Northern Ireland's academic research base amongst groups. Participants also suggested that technological advancement had been born from necessity, one contributor referred to an Economist article which claimed that 15 renewable energy technologies had been developed globally as a result of oil rising to £150 per barrel. Participants expressed the view that future needs would continue to drive technology, for Northern Ireland to lead the way. However, the government must assist in creating a business environment conducive to innovation. As outlined above, groups expressed concern that the lack of an indigenous renewable energy market may be contributing to a brain drain and motivating innovative firms to seek markets elsewhere. 5.4 The energy mix What delegates saidStakeholders questioned why there was an over-reliance on wind energy in Northern Ireland. Issues of intermittency and energy storage were raised by some. It was suggested that the focus on wind power was understandable since the technology was at a later stage of development and because 'wind power was the easiest to harness'. In general, groups were supportive of a varied energy mix. Two arguments in favour of this were raised. Firstly, a varied energy mix would supply consistency by providing alternatives during periods of no wind. Secondly, it would allow public and private sector investors to spread risk. In a related point, some suggested that technological solutions to energy production should only be viewed as part of the solution. To some, ensuring energy efficiency was an important initial step. CommentaryAs outlined in Table 2 (above), in all of DETI's five scenarios for energy generation in 2020, wind is the dominate form of renewable generation. It is, in fact, envisaged to be the second largest form of generation, with only traditional fossil fuel generation providing more generation to the mix.[47] This reliance is likely to be pragmatic as 'onshore wind energy is the most economically and technically advanced of all renewables, able to compete in cost with other conventional generation and deliver on a large scale'.[48] [1] Sustainable Energy Authority of Ireland, Marine Renewable – a development opportunity for Ireland presentation to Committee for Enterprise, Trade and Investment renewable energy workshop event 18 May 2010 [2] Ibid [3] Ibid [4] European Commission, Eurostat Panorama of energy - Energy statistics to support EU policies and solutions (2009) p34-37 [5] World Council for renewable energy, Danish Renewable Energy Policy http://www.wcre.de/en/images/stories/pdf/WCRE_Maegaard_Danish_RE_Policy.pdf (accessed 09/06/2010) [6] European Commission, Eurostat Panorama of energy - Energy statistics to support EU policies and solutions (2009) p34-37 [7] Ibid [8] Danish Energy Agency, Energy technology 11% of total Danish goods exports Denmark is spearheading development and export of energy technology and equipment http://www.ens.dk/en-US/Info/news/Factsheet/Documents/EKSPORTTEK.pdf_engelsk.pdf (accessed 09/06/2010) [9] European Commission, Eurostat Panorama of energy - Energy statistics to support EU policies and solutions (2009) p34-37 [10] Ibid [11] European Commission, Eurostat Panorama of energy - Energy statistics to support EU policies and solutions (2009) p37 - 40 [12] Ibid [13]Eberhard Jochem, Reinhard Madlener, and Wilhelm Mannsbart, "Renewable Energy Technology Diffusion: Prospects of the German and Swiss Industry in the World Markets," Proceedings of the World Renewable Energy Congress VII (2002) [14] Action Renewables A Study into the Renewable Energy Resource in the Six Counties of Northern Ireland (July 2004) [15] Ibid [16] Ibid [17] Action Renewables A Study into the Renewable Energy Resource in the Six Counties of Northern Ireland (July 2004) [18] DETI A Draft Strategic Energy Framework for Northern Ireland 2009 (July 2009) p38 [19] Action Renewables A Study into the Renewable Energy Resource in the Six Counties of Northern Ireland (July 2004) [20] DETI A Draft Strategic Energy Framework for Northern Ireland 2009 (July 2009) p38 [21] Ibid [22] Oxford Economics/DEL, Forecasting future skill needs in Northern Ireland – Final report (2009) [23] Ibid [24] Ibid [25] Ibid [26] Department for Employment and Learning, Qualifications gained at UK Higher Education Institutions: Northern Ireland analysis 2008/09 pp14-19 http://www.delni.gov.uk/he_qualifications_0809.pdf [27] Oxford Economics/DEL, Forecasting future skill needs in Northern Ireland – Final report (2009) [28] DETI The Northern Ireland renewable Obligation (NIRO) An Outline of its Operation http://www.detini.gov.uk/niro_-_how_it_works__2_.pdf (accessed 10/06/2010) [29] Feed in Tariff UK Facts on Feed-in-Tariff http://www.fitariffs.co.uk/ (accessed 10/06/10) [30] Friends of the Earth, The Green New Deal for Northern Ireland, http://www.foe.co.uk/resource/briefings/ni_green_new_deal.pdf (accessed 10/06/2010) [31] Ibid [32] It should be noted that while the Energy Act extends to the whole of the UK a large proportion of its provisions do not extend to Northern Ireland. [33] Euractiv, EU renewable energy policy http://www.euractiv.com/en/energy/eu-renewable-energy-policy/article-117536 (accessed 10/06/10) [34] The Guardian Minister confirms retreat from 20% renewable energy target (Oct 2009) http://www.guardian.co.uk/environment/2007/oct/24/renewableenergy (accessed 10/06/2010) [35] DECC The UK Renewable Energy Strategy (2009) p8 [36] Energy Ireland Yearbook 2010 p17 [37] Northern Ireland Assembly Official Report, Tuesday 8 June 2010, http://archive.niassembly.gov.uk/record/reports2009/100608.htm (accessed 10/06/2010) [38] DETI A Draft Strategic Energy Framework for Northern Ireland 2009 (July 2009) p21 [39] DECC Renewable Heat Incentive Consultation on the proposed RHI financial support scheme (February 2010) [40] DETI A Draft Strategic Energy Framework for Northern Ireland 2009 (July 2009) p17 [41] Ibid [42] Northern Ireland Audit Office The Performance of Northern Ireland's Planning Service – Report to the Northern Ireland Assembly by the Comptroller and Auditor General http://www.niauditoffice.gov.uk/pubs/onepress.asp?arc=False&id=231&dm=0&dy=0 (accessed 11/06/2010) [43] EirGrid Grid 25 http://www.eirgrid.com/EirgridPortal/uploads/Announcements/EirGrid_GRID25.pdf [44] DECC Renewable energy awareness and attitudes research: management summary (2009) [45] Ibid [46] Central Office of Information on behalf of: Department of Trade and Industry Scottish Executive, National Assembly for Wales, Department of Enterprise, Trade and Investment, Attitudes and Knowledge of Renewable Energy amongst the General Public (August 2003) [47] DETI A Draft Strategic Energy Framework for Northern Ireland 2009 (July 2009) p38 [48] Renewable UK (formally British Wind Energy Association) Onshore Wind: Powering Ahead A Report Prepared by BWEA (2006)
13 September 2010Aidan StennettIncentivising renewable electricity – a comparison of Renewable Obligation Certificates and Feed-in tariffsNIAR 300-10Paper examining the two main financial incentives used to stimulate renewable electricity development in Europe. Paper 300-10 13 September 2010 Executive SummaryThe following paper outlines two incentives designed to stimulate renewable electricity generation – Renewable Obligation Certificates and Feed-in Tariffs – as well as examining the debate surrounding their relative effectiveness. It should be noted that Northern Ireland does not have legislative powers to introduce a Feed-in Tariff at this point. Renewable Obligation CertificatesThe Renewable Obligation model is a quota based system that requires electricity suppliers (or transmission service operators in some cases) to supply increasing amounts of electricity sourced from renewable generation. In order to demonstrate that their obligations have been met suppliers must produce a Renewable Obligation Certificate (ROC) for every Megawatt hour (MWh) of electricity they supply to the relevant authority (Ofgem in the UK). Should they fail to produce the predetermined amount of ROCs, suppliers are required to pay a buy-out fee (in Northern Ireland this was £37.19 per MWh during 2009/10). The proceeds of this buy-out fee are redistributed amongst suppliers who have produced the required amount of ROCs in a particular period. ROCs are issued, free of charge, to generators for every MWh of renewable electricity produced. These are then sold to suppliers as a separate entity to the electricity itself. This has the effect of creating two markets and two revenue streams for generators – the electricity market and the ROC market. ROCs act as a premium on top of the market price (spot price) of electricity, and as such act as an incentive to RE development by contributing to its cost. Demand, within ROC market, is stimulated by the legal requirement placed upon suppliers to produce an increasing number of certificates at the end of each obligation period. The buy-out fee and redistribution mechanism serve as an extra incentive for suppliers to purchase and hold ROCs. Since the price of a ROC and the price paid for renewable electricity are determined by market forces, the revenue streams available to generators in jurisdictions operating this system are variable. Northern Ireland, like the rest of the UK utilises ROC system. These systems offer different incentives for specific technology types by banding ROC levels according to technology (e.g. Onshore wind up to 50kw installed capacity receives the equivalent of four ROCs per MWh produced, where as Offshore wind receives the equivalent of two ROCs). Certificates issued as part of the Northern Ireland Renewable Obligation and Great Britain Renewable Obligation are mutually tradable across the UK. Feed-in TariffsAt their most basic FITs work by setting a fixed price for renewable electricity for a fixed rate of time. Suppliers (or transmission service operators) are obliged to purchase every MWh of renewable electricity produced. There are two broad categories of FITs – market-independent FITs and market-dependent FITs. Within each category there are number of subcategories which operate at various levels of complexity. There are four examples of market-independent FITs:
Market-dependent FITs include:
The recently introduced UK FIT is comprised of two fixed rate tariff types – a generation tariff and an export tariff. The cost of providing these tariffs is to be taken-up by electricity suppliers (with a minimum of 50,000 domestic customers), with allowance made for implementation costs. DebateThe debate surrounding the two broad incentive models – ROC and FITs – considers the following issues: Investment and renewable energy development: Germany has operated a market-independent FIT since 1991 and Denmark operated a similar model between 1993 and 2004. Both regions have experienced a more rapid growth in renewable electricity than the UK which has moved from a Non-Fossil Fuel Obligation (1998-2002) to a ROC system (2002 to present). The literature suggests that market-independent FIT models tend to lead to the rapid development of renewable electricity. The greater security offered to investors by market-independent FIT models is often cited as one of the key reasons for their success. By contrast, market-dependent systems (the ROC model in particular) do not allow for the same degree of predictability as market-independent system and have proven less effective. They do, however, retain the potential of offering high-profit margins. Long-term contracts are available as part of the ROC system but they often lead to a reduction in value per ROC. Significantly, long term contracts are not an intrinsic element of ROC arrangements (as it is with market-independent FITs); the onus is placed upon the generator to secure terms with a supplier. Issues surrounding risk and the availability of financing are heightened under current economic conditions. Market diversity: The low-risk nature of FIT systems ensures that they have a tendency to encourage a number of different types of energy generator into the market, local-community groups, for example. This has led to a decentralised energy market in many regions utilising FIT models. By contrast, market orientated solutions, including ROCs, tend to favour producers who can 'hedge these risks effectively'. This often results in a market dominated by large-scale producers. Funding and impact on consumers: FIT and ROC models often place a burden to pay on the industry which is subsequently passed onto the consumer. There is evidence to suggest that RE is cheaper in Germany than in the UK. Further research, to determine the extent to which this is attributable to the incentives employed, as opposed to other factors, may be desirable. A number of studies suggest that 'willingness to pay' amongst consumers in the UK is increasing. In other words, a greater proportion of consumers are willing to pay more for the electricity to secure 'green benefits'. Increasing the retail price of electricity in this way runs the risk of environmental policy competing with other social policies – particularly fuel poverty. As such, incentives must be carefully managed to ensure price increases are not borne by the fuel poor. As an alternative, renewable electricity models may be funded by government subsidy – effectively transferring the cost for the customer to the tax payer. Funding incentives in this way gives rise to a different set of potential problems. The future security of project financing becomes dependent on government budgets, the current squeeze on public financing exemplifies the dangers this could hold. EU Harmonisation: Finally, both FITs and ROCs appear compatible with the European Commission's plans to harmonise EU renewable energy policy. Operating on an EU level, it is argued, will have specific benefits for ROCs – most notably driving down the cost of renewable development. Contents1 Introduction 2 Renewable Obligation Incentives 3 Feed-in tariffs 3.1 FIT models 3.3 The UK FIT 4 Discussion 4.1 Investment and renewable electricity development 4.2 Market diversity 4.3 Funding and the impact on consumers 4.4 EU Harmonisation 5 Conclusions 1 Introduction The development of renewable energy globally has been accompanied by a debate over how best to incentivise this growth. This debate has focussed on two main mechanisms – the market-orientated Renewable Obligation quota method (ROC) and the price led Feed-in Tariff model (FIT) – both which have been utilised to encourage development of renewable electricity (RE). The purpose of this paper is to outline how these mechanisms operate and to examine the associated debate with a particular emphasis on each incentive's ecological and economic effectiveness. It should be noted that Northern Ireland does not have legislative powers to introduce a FIT at this point.[1] 2 Renewable Obligation Incentives Renewable obligation schemes are quota based incentives to renewable electricity development. Their operation is typified by the systems in operation in the UK, both the Northern Ireland Renewable Obligation (NIRO) and Great Britain Renewable Obligation (GBRO) UK renewable obligations legally require electricity suppliers to source an increasing proportion of their electricity from renewable sources. At the end of each obligation period, suppliers present Renewable Obligation Certificates (ROC) to Ofgem to prove they have supplied the required amount of RE[2]. Suppliers who fail to meet with the obligation are required to pay a buy-out fee to Ofgem at the end of the obligation period (obligation periods last one financial year). During 2009/10 the buy-out fee was set at £37.19 per MWh of obligation not met. The proceeds of each year's buy out fee are redistributed amongst suppliers who met the quota. Suppliers purchase certificates from RE generators. Ofgem issues ROCs to generators for every MWh of RE they produce free of charge. Generators sell electricity and ROCs as two separate entities. This creates two separate markets providing two separate revenue streams. In the first instance, revenue is gained from selling electricity at the market price - the RE generator will compete with fossil fuel generators in this market, potentially incurring a relative loss due to the cost disadvantage of renewables. This loss may be recouped accessing the second revenue scheme – selling ROCs at their market price.[3] Demand, within ROC market, is stimulated by the legal requirement placed upon suppliers to produce an increasing number of certificates at the end of each obligation period[4], and as such, were there is a shortfall in ROCs in any period the market value will, theoretically, increase[5]. The buy-out fee and redistribution mechanism serve as an extra incentive for suppliers to purchase and hold ROCs. It also ensures that the market-value of a ROC remains above the buy-out fee as from a suppliers perspective the value of a ROC is equal to the buy-fee plus the redistributed fund.[6] In providing additional revenue streams, ROCs act as a premium on top of the market price (spot price) of electricity, and as such act as an incentive to RE development by contributing to its cost.[7] However, since the revenue streams supplied to renewable generators through the ROC scheme is determined by the market, the price for electricity produced and the ROC top-up premium received are variable. ROC schemes can be designed to differentiate between various technologies, by weighting certificates for each technology.[8] This approach has been adopted in the UK. Table 1 provides an overview of 2010 ROC values for different technologies for the NIRO. In addition to the figures in Table 1 all microgeneration up to 50KW receives two ROCs per MWh produced, except for the hydro which receives two ROCs per MWh up to 1MW and onshore wind which receives two ROCs per MWh up to 250KW of installed capacity. Certificates issued as part of the NIRO and GBRO are mutually tradable across the UK. Table 1: 2010 ROC banding by technology – NIRO[9]
3 Feed-in tariffs As of 2008, 63 jurisdictions worldwide were operating a form of Feed-In tariff (FIT).[10] The mechanism has support at EU level: …well adapted Feed-In tariff regimes are generally the most efficient and effective support schemes for promoting renewable electricity.[11] FITs have also been identified as a significant contributory factor to the development of new renewable energy technologies in those regions typically identified as European success stories: Renewable Energy Feed-In Tariffs have been used to support what are to date the three biggest (in terms of contribution to national electricity requirements) renewable energy programmes in Denmark, Germany and Spain.[12] This is not to say that FITs have acted as the sole catalyst for renewable energy development in these regions (other issues, not least cultural factors and political impetus have played a role – such factors will be examined as part of a subsequent research).[13] Nor is it the case that the FIT system is without criticism and disadvantages (see below). At its most basic a FIT offers a guaranteed price for RE for a fixed period of time. The price offered can be tailored to suit particular technology types, installation sizes, the resource quality, the location of the project, etc. In many cases the FIT price paid for electricity corresponds to its generation cost, allowing for the cost-effective development of the technology. Furthermore, by guaranteeing a clearly determined payment for a fixed period of time FITs can reduce the risk associated with investment in renewable generation.[14] As such, it is generally recognised that FITs can, if administered effectively, stimulate rapid RE growth.[15] [16] 3.1 FIT modelsThe specific form a FIT takes is often determined by the context in which it is developed, i.e. the FIT is usually country specific (FITs are determined by and operated on a federal or regional government level[17]). There are, however, two broad categories of FIT – Market-dependent FITs and Market -independent FITs – within which exist a number of common sub-categories. Market–independent tariffs generally offer a fixed price for RE sold to the grid. Market-dependent tariffs comprise of a fixed RE premium, paid on-top of the spot price for electricity. The latter tariff results prices which vary in-line with the wider market.[18] Importantly, under each model type 'the lawmaker obliges regional or national transmissions systems operators (or supplier) to feed in the full production of 'green' electricity'[19]. In other words they are obliged to purchase all RE electricity produced within their region. There are four sub-categories within the broad market-independent category:
Three market-dependent models are identified in the literature each operating with a varying degree of complexity;
3.3 The UK FITThe Labour Government launched a FIT on the 1 April 2010. The tariff, which is applicable to England, Scotland and Wales, but not Northern Ireland[22], is targeted towards small-scale renewable generation – installations below 5MW[23] (as such it will run in conjunction with the Renewable Obligation Certificate, although the ROC will be used to incentivise large-scale generation primarily[24]). The FIT is comprised of two fixed rate tariff types, a generation tariff (details of which are outlined in Table 2) and an export tariff. The cost of providing these tariffs is to be taken-up by electricity suppliers (with a minimum of 50,000 domestic customers), with allowance made for implementation costs: …it is a basic principle of FITs that the cost of the scheme should be borne by all licensed suppliers in proportion to their share of the UK electricity supply market… broadly speaking suppliers who pay out a large amount on FITs relative to their market share are recompensed for part of that expense by suppliers who spend relatively less on FITs payments.[25] This process of 'levelisation' will be carried out by Ofgem in their roll as scheme administrators: On an annual basis, suppliers will provide information to Ofgem on FITs payments they have made and other relevant information. Ofgem will use this and other sources to calculate the total cost of the scheme, and to divide that cost among all the suppliers according to their share of the electricity market (excluding any imports of green electricity from outside GB). Suppliers who have paid out less than their calculated share – including those that are not offering FITs – will need to pay into a fund administered by Ofgem. This will then be redistributed to those that have paid out more than their share.[26] Examining the tariffs in more detail, the generation tariff is paid to households regardless of whether they export the energy generated to the grid or not. The tariff will guarantee a price rate, index-linked to inflation and differentiated according to technology type, for a twenty year period for most technology types (twenty-five years for solar PV, see Table 2 for further details). It is also proposed that the tariff will be reviewed every five years (beginning 2013) and that it will remain subject to the 'principle of degression'.[27] The latter point is explained as follows: …some technologies are expected to get cheaper as volumes build in the future, so the Government has decided to adjust some tariff levels for systems installed after April 2012.[28] The export tariff is set a 3p/kWh (linked to inflation) for all technology types. At present, in lieu of the widespread installation of smart metering, export levels are calculated at 50% of total power generated. Households have the option of installing an approved metering system if they believe they are exporting more than this assumed figure. Those who take up the scheme will also be given the option to opt out of the baseline 3p/kWh rate. Taking this option will allow small-scale generators to negotiate a price with their electricity supplier. It is estimated that installation of a 2.5KWs of Solar PV in an average three to four-person household consuming approximately 4,500KWh per annum will result in a tax free income of £836 per annum via the FIT. This would be accompanied by a reduction in electricity cost from £450 per annum to £300 per annum.[29] The FIT scheme does not set tariff rates for certain technologies. Biomass, landfill gas, waste-to-energy and power from liquid biofuels are excluded on the basis that they are technologies typical to large-scale electricity generation. The exclusion of 'innovative technologies' – wave, tidal and geothermal – is due to their limited use, which the government argued, prevented a tariff being established.[30] The FIT, as it currently exists, is a policy introduced by the former UK government. Both the Conservatives and Liberal Democrats, in their election manifestos, made commitments to retain, but alter the policy. The Conservatives made a pledge to extend the 5MW ceiling, where as the Liberal Democrats promised a more attractive FIT. The Coalition Programme for Government has made a commitment to: …establish a full system of Feed-In tariffs in electricity – as well as the maintenance of banded Renewables ObligationCertificates.[31] Table 2: UK FIT – tariff levels by technology type[32]
4 Discussion 4.1 Investment and renewable electricity developmentThe key aim of both incentives is to encourage investment in, and thereby increase the penetration of, renewable electricity generation. Examining the jurisdictions that have utilised the two policy types, it is evident that both have succeeded in driving up RE generation, although the rates of success have been varied. Germany has operated a market-independent feed-tariff system since 1991.[33] In terms of installed capacity the region is the world leader in wind and solar energy production. By 2005 Germany had achieved 18,428MW of installed wind capacity and 1,400MW of installed solar capacity. This allowed the region to meet 10.2% of its electricity needs from renewable generation in that year.[34] Denmark employed a FIT between 1993 and 2004; during this period wind power penetration grew from 500MW to over 3,000MW.[35] Measured in capacity installed, by 2005, Denmark's level of renewable penetration ranked fifth in the world. However, examined from a per capita basis the region is a world-leader in installed capacity. In 2005, 3,122MW of installed wind capacity provided for 20% of the country's electricity demand.[36] The UK ROC system has led to an increase RE penetration. The UK's installed RE capacity was 1,700MW in 2004, representing approximately 3% of electricity consumption. However, the largest proportion of this capacity was installed under the previous Non-Fossil Fuel Obligation (1989-2002), with 700MWs of the 2004 capacity attributed to the ROC scheme.[37] Figure 1 provides a comparison of wind power development between 1998 and 2008. In the period covered, the main financial incentive utilised by the German government was the FIT model (the model has underwent a number of alteration throughout its lifespan), whereas the UK system during this period operated under the Non-Fossil Fuel Obligation between 1989 and 2002, followed by the ROC system from 2002 onwards. The figure demonstrates that although both regions began at a similar level, the growth of wind generation in Germany has been significantly more successful than in the UK. Other factors are likely to have had an impact on these development trajectories, not least 'guaranteed grid access' and 'relatively smooth administrations procedures'.[38] As evidenced in the statement from the European Commission above, there is a consensus that FIT model, as adopted in Germany, has had a significant impact in fostering RE development within the region.[39] By guaranteeing the price of RE for predetermined periods of time (20 years or more) and obliging suppliers/transmission services operators to purchase all RE produced, fixed rate, market-dependent model FITs offer security to investors.In other words:By basing the payments levels on the cost required to develop RE projects, and guaranteeing the payment levels for the lifetime of the technology, FITs can significantly reduce the risks of investing in renewable energy technologies and thus create conditions to rapid market growth.[40] It is this aspect of the model that has seen it result in rapid RE development.By contrast, the revenue streams provided to renewable energy generators through the ROC model and, to a varying extent, market-dependent FIT models, are intrinsically linked to movements of the wider electricity market and are therefore subject to variability. As such, investors may be put off RE projects due to the large upfront costs associated with development without a guaranteed return on investment.[41] Market-dependent systems do not allow for the same degree of predictability as market-independent system and have proven less effective in stimulating investment. They do, however, retain the potential of offering high-profit margins.[42] Long-term stability and predictability is not impossible within a market-dependent system, particularly within the ROC system. It does, however, come at a cost: The market in ROCs is a very competitive one, but most renewable energy generators require contracts to cover ten years in length. These contracts mostly specify appropriate levels of income in return for electricity to satisfy bankers and equity investors who provide the capital investment for the projects. In order to gain these contracts electricity suppliers have to exchange the part of the value of the ROCs for the security that is offered by a long term contract with a credit-worthy supplier.[43] Significantly, long term contracts are not a guaranteed element of ROC arrangements; the onus is placed upon the generator to secure terms with a supplier. This is in contrast to the fixed rate FIT which places a legal obligation on transmission system operators or suppliers to purchase renewable electricity from generators at a fixed rate, for a fixed length of time. Such issues are likely to be increasingly significant as a result of recent economic conditions, particularly the difficulty businesses are experiencing in securing credit.[44] Figure 1: Wind power development in the UK and Germany 1992-2008[45]
4.2 Market diversityThe contrasting investment security offered by the models outlined above has the potential to affect the types of actors who invest in the RE market. The lower risk associated with the fixed-rate FIT model may help to encourage non-traditional investors into the market, particularly small-scale investors and community groups.[46] By encouraging local ownership it may become possible to diminish local objections to renewable technologies. The growth of Denmark's wind industry is, in part, attributed to this. For example, a government report noted: The local environmental disadvantages can lead to a lack of public acceptance of wind farms. Local ownership wind turbines (local farmers, co-operatives or companies) can ensure local acceptance of projects.[47] The German experience also suggests that the FIT model has helped develop an electricity system with a variety of participants rather than 'conventional groups': …the Renewable Energy Sources act has also brought about the development of a highly diverse set of actors. Many new businesses have been founded. This is due, in particular, to the fact that all the participants on the market have been able to obtain loans on account of the high degree of security for investors offered by rates of compensation that are set for 20 years.[48] (Emphasis added) It should be noted that whilst FIT tariffs have been shown to aid diversity in the market place, by encouraging the entry of smaller companies and community groups, they are not a prerequisite to such an occurrence nor do they guarantee it. The Netherlands, for example, operated a system of tradable green certificates between 1996 and 2002, a period that coincided with a significant increase in the number of farmer-owned wind farms. This growth was aided by market liberalisation which allowed farmers to choose the most lucrative contract for supplying electriricty to the grid. This position was enhanced by the formation of a farmers lobby which was able to obtain better contracts from electricity companies.[49] However, it is generally accepted that the increased risk associated with ROCs and other market based systems result in a market dominated by large-scale producers, i.e. producers who can 'hedge these risks effectively':[50] Furthermore: Compared to a minimum risk approach, higher market risks increase the project cost for renewable electricity generators. Consequently a higher level of financial support is required to stimulate renewable electricity development.[51] This tendency towards large-scale investors is true of market-dependent FIT models also. For example, the Spanish electricity market, which adopted a variable premium FIT policy design (see section 3.1), has a greater concentration of corporate investors than the UK.[52] 4.3 Funding and the impact on consumersThe cost of implementing both FIT and ROC models are often placed upon the industry. In the case of FITs, the obligation to purchase RE electricity at a favourable rate (and paying the generation tariff in the case of the UK) increases transmission system operators or electricity supply companies costs. These costs are in turn passed onto consumers in the form of increased retail electricity prices.[53] Similarly, the ROC system introduces a form of premium for RE, which is again is transferred from the supplier or TSO onto the customer.[54] The question of which method represents best value for consumers is a difficult one to answer. With regard to the ROC model, the assumption is that increased investment will lead to increased competition which will in turn serve to drive overall prices down.[55] As outlined above, evidence suggests that the UK ROC has led to a limited increase in RE penetration. Furthermore, to determine whether a specific ROC system is more competitive than a fixed-rate FIT system (for example), it is necessary for the competitive pressures on the market to reduce prices in the former system to below that fixed rate (the outcome of such comparisons would also depend on what region's FIT was considered). This is further complicated by the trade in ROCs themselves which are a profitable commodity to energy suppliers and generators (who may be one and the same). There is some evidence to suggest that the FIT system has led to cheaper RE than the ROC system. For example, one kWh of wind power in Germany cost approximately €0.08; in the UK it is €0.14[56]. Whether this is due to the incentives employed by each region, rather than other factors, is difficult to determine. Further research on this issue may be desirable. There is, however, evidence to suggest that consumers are willing to pay more for their electricity in order to secure 'green benefits'. A variety of studies in the following years, 1998, 2001, 2004 and 2006 found that 20%, 35%, 40% and 64% of consumers, respectively, were willing to pay a premium for green energy. This increased 'willingness to pay' has been attributed to greater awareness of environmental issues.[57] Despite this, that increased energy prices are linked to incentives to stimulate RE penetration, there runs the risk of placing environmental policy at odds with other social policies – particularly fuel poverty. Friends of the Earth, in their defence of FITs note that with the introduction of any incentive to promote renewable electricity 'the impact on the fuel poor must be very carefully considered'.[58] An alternative to placing the cost on the industry is for the government to subsidise the FITs. The result of this is to shift the cost from the bill payer to the tax payer (a method employed by the Netherlands[59]). This method also has drawbacks. Specifically, funding of FITs and the developments of RE in general becomes: …contingent on a specific budgetary allocation, [and] there is a risk that the budget will become exhausted, or will fail to be renewed…[60] Furthermore, the more successful a FIT policy the more strain it will put on government resource which in turn may place strain on the longer-term future of the policy itself.[61] 4.4 EU HarmonisationThe harmonisation of EU renewable electricity markets remains a policy at European Commission level. Harmonisation, it is argued, has a number of benefits. Current thinking regarding harmonisation does not rule out the: …creation of a system of green certificates at the European level that would be more wide-ranging and therefore more liquid, making it possible to ensure greater price stability on national markets.[62] Nor does it rule out the creation of: …a common Feed-In tariff system for the whole of Europe, bearing in mind the availability of resources at the local level. This could lower the cost of all RES technologies in the different Member States once installations are no longer reserved for only some of them.[63] Both incentive models therefore are likely to be compatible with future EU plans. Harmonisation may also have specific benefits for the ROC system. Operating the ROC system at a pan-European level 'is likely to bring about a more stable price of certificates and alleviate the problems in setting an adequate quota'. Furthermore, it is argued, that a European ROC market for ROCs 'can allow a satisfactory degree of liquidity in the market for technology specific certificates'. Finally, a European market for ROCs may also serve to drive down the cost of RE by encouraging growth in areas of lowest marginal cost.[64] It should be noted, however, that the European Commission has stated that harmonisation seems unlikely in the short-term.[65] 5 Conclusions Drawing on the discussion above, it is evident that market-independent incentives, such as fixed-rate feed in tariffs, and market-dependent models, such as ROCs, have both led to increased RE in the regions they are employed in. Evidence suggests that the market independent FITs have yielded more success, particularly in Germany and Denmark, than ROCs in the UK. The greater security offered to investors by market-independent FIT models is often cited as one of the key reasons for their success. Investment security has become increasingly significant in light of recent economic conditions. It should be noted that neither model type operates in isolation; other factors will influence the growth of renewables in a specific region (these points are to be explored in a subsequent research paper). The low-risk nature of FIT systems ensures that they have a tendency to encourage a number of different types of energy generator into the market, local-community groups, for example. This has led a decentralised energy market in many regions utilising FIT models. Local community involvement has the added benefit of helping to overcome some of the local (often planning related) objections to renewable technology proliferation. ROC models, by contrast, favour large-scale producers who can effectively hedge the greater level of risk. FIT and ROC models often place a burden to pay on the industry which is passed onto the consumer. Given the unknowns involved in the ROC system and the variety of FIT models in operation globally it is difficult to determine which is the most cost efficient method. There is evidence to suggest that RE is cheaper in Germany than in the UK. Further research, to determine the extent to which this is attributable to the incentives employed, as opposed to other factors, may be desirable. However, that both models lead to higher retail electricity costs is, in the short-term, unavoidable (with the exception of funding FIT incentives through tax, a method of funding that gives rise to its own potential problems). Energy derived from renewable is likely to be at cost-disadvantage to other forms of generation, until such time as they become cost-effective due to widespread proliferation. Two issues should be considered in relation to cost. Firstly, there is evidence to suggest that consumers may be willing to pay more for their electricity if it is derived from renewable sources. At the same time, any moves that serve to increase the cost to the consumer should be carefully managed to ensure that environmental policy does not conflict with other social policies – notably fuel poverty. Finally, both FITs and ROCs appear compatible with European Commissions plans to harmonise EU renewable energy policy. Operating on an EU level, it is argued, will have specific benefits for ROCs – most notably driving down the cost of renewable development. [1] DETI, Proposed changes to the Northern Ireland renewables obligation, (February 2010) http://www.northernireland.gov.uk/news/news-deti/news-deti-february-2010/news-deti-120210-proposed-changes-to.htm (accessed 13/09/10) [2] DETI, The Northern Ireland Renewable Obligation – an outline of its operation http://www.detini.gov.uk/niro_-_how_it_works__2_.pdf (accessed 09/09/10) [3] Ringel, M, Fostering the use of renewable energies in the European Union: the race between Feed-In tariffs and green certificates, Renewable Energy 31 (2006) p8 [4] Held, A et al, On the success of policy strategies for the promotion of electricity from renewable energy sources in the EU http://eeg.tuwien.ac.at/eeg.tuwien.ac.at_pages/publications/pdf/HAA_PAP_2006_1.pdf (accessed 03/09/10) [5] Toke, D, Are electricity certificates the way forward for renewable energy? An evaluation of the UK's Renewables Obligation in the context of international comparisons (2005) http://www.wind-works.org/FeedLaws/Great_Britain/DavidTokeAregreenelectricitycertificatesthewayforaward.doc (accessed 03/09/10) [6] Klessmann, C et al. Pros and cons of exposing renewables to electricity marker risks – A comparison of the market integration approaches in Germany, Spain and the UK, Energy Policy 36 (2008) p3654 [7] Held, A et al, On the success of policy strategies for the promotion of electricity from renewable energy sources in the EU http://eeg.tuwien.ac.at/eeg.tuwien.ac.at_pages/publications/pdf/HAA_PAP_2006_1.pdf (accessed 03/09/10) [8] Ibid [9] DETI, NIRO Banding levels 2010 http://www.detini.gov.uk/niro_2010_banding_levels_table.pdf [10] Couture, T. et al An analysis of Feed-In tariff remuneration models: Implications for renewable energy investment, Energy policy 38(2010) p955 [11] Ibid [12] Toke, D, Are electricity certificates the way forward for renewable energy? An evaluation of the UK's Renewables Obligation in the context of international comparisons (2005) http://www.wind-works.org/FeedLaws/Great_Britain/DavidTokeAregreenelectricitycertificatesthewayforaward.doc (accessed 03/09/10) [13] Ibid [14] Couture, T. et al An analysis of Feed-In tariff remuneration models: Implications for renewable energy investment, Energy policy 38(2010) p955 [15] Ibid [16] Ringel, M, Fostering the use of renewable energies in the European Union: the race between Feed-In tariffs and green certificates, Renewable Energy 31 (2006) pp1-17 [17] Resch, G, et al. Feed-in tariffs and quotas for renewable energy in Europe CESifo DICE Report 4/2007 p26 [18] Couture, T. et al An analysis of Feed-In tariff remuneration models: Implications for renewable energy investment, Energy policy 38(2010) p955 [19] Ringel, M, Fostering the use of renewable energies in the European Union: the race between Feed-In tariffs and green certificates, Renewable Energy 31 (2006) p6 [20] Couture, T. et al An analysis of Feed-In tariff remuneration models: Implications for renewable energy investment, Energy policy 38(2010) p955 [21] Ibid [22] Energy Act 2008 (c.32), Part 6 General (s112 [2b]) http://www.fitariffs.co.uk/library/regulation/08_Energy_Act.pdf (accessed 08/09/10) [23] Feed-in Tariffs, What are Feed-In tariffs http://www.fitariffs.co.uk/FITs/ (accessed 08/09/10) [24] DECC, Feed-in Tariffs, http://www.decc.gov.uk/en/content/cms/what_we_do/uk_supply/energy_mix/renewable/feedin_tariff/feedin_tariff.aspx (accessed 08/09/10) [25] DECC, Feed-in Tariffs – Government's response to the Summer 2009 consultation (February 2010) p41 http://www.fitariffs.co.uk/library/regulation/100201FinalDesign.pdf (accessed 08/09/10) [26] Ibid [27] Feed-in Tariffs, Duration and variations http://www.fitariffs.co.uk/FITs/principles/future/ (accessed 08/09/10) [28] Feed-in Tariffs, Tariff degression http://www.fitariffs.co.uk/FITs/principles/degression/ (accessed 08/09/10) [29] Feed-in Tariffs, What are Feed-in tariffs http://www.fitariffs.co.uk/FITs/ (accessed 08/09/10) [30] Feed-in Tariffs, Energy sources and systems that will not be eligible for the Feed-In Tariffs http://www.fitariffs.co.uk/eligible/energies/excluded_installations/ (accessed 08/09/10) [31] Coalition Programme for Government (2010) http://www.cabinetoffice.gov.uk/media/409088/pfg_coalition.pdf p16 (accessed 08/09/10) [32] DECC, Table of Tariff sizes http://www.decc.gov.uk/en/content/cms/what_we_do/uk_supply/energy_mix/renewable/feedin_tariff/feedin_tariff.aspx (accessed 10/09/10) [33] Kelssmann C, et al. Pros and cons of exposing renewables to electricity market risks – A comparison of the market integration approaches Energy policy 36 (2008) p3650 [34] Lipp, J, Lessons for effective renewable electricity policy from Denmark, Germany and the United Kingdom, Energy Policy 35 (2007) p5491 [35] Global feed in Tariffs http://www.globalfeedintariffs.com/global-feed-in-tariffs/ (accessed10/09/10) [36] Lipp, J, Lessons for effective renewable electricity policy from Denmark, Germany and the United Kingdom, Energy Policy 35 (2007) p5491 [37] Lipp, J, Lessons for effective renewable electricity policy from Denmark, Germany and the United Kingdom, Energy Policy 35 (2007) p5491 [38] Klessmann, C et al. Pros and cons of exposing renewables to electricity marker risks – A comparison of the market integration approaches in Germany, Spain and the UK, Energy Policy 36 (2008) p3658 [39] Couture, T. et al An analysis of Feed-In tariff remuneration models: Implications for renewable energy investment, Energy policy 38(2010) p955 [40] Ibid [41] Ibid [42] ld, A et al, On the success of policy strategies for the promotion of electricity from renewable energy sources in the EU http://eeg.tuwien.ac.at/eeg.tuwien.ac.at_pages/publications/pdf/HAA_PAP_2006_1.pdf (accessed 03/09/10) [43] Toke, D, Are electricity certificates the way forward for renewable energy? An evaluation of the UK's Renewables Obligation in the context of international comparisons (2005) http://www.wind-works.org/FeedLaws/Great_Britain/DavidTokeAregreenelectricitycertificatesthewayforaward.doc (accessed 03/09/10) [44] The Guardian, Availability of credit a matter of life and death for small business http://www.guardian.co.uk/business/2010/jul/28/credit-life-death-small-businesses (accessed 13/10/10) [45] Fell, H-J (spokesperson on energy and technology policy for the Breen Parliamentary group in the German Bundestag) Feed-in Tariff for Renewable Energies: an effective stimulus package without New Public Borrowing [46] Ibid [47] Toke, D, Are electricity certificates the way forward for renewable energy? An evaluation of the UK's Renewables Obligation in the context of international comparisons (2005) http://www.wind-works.org/FeedLaws/Great_Britain/DavidTokeAregreenelectricitycertificatesthewayforaward.doc (accessed 03/09/10) [48] Fell, H-J (spokesperson on energy and technology policy for the Breen Parliamentary group in the German Bundestag) Feed-in Tariff for Renewable Energies: an effective stimulus package without New Public Borrowing [49] Toke, D, Are electricity certificates the way forward for renewable energy? An evaluation of the UK's Renewables Obligation in the context of international comparisons (2005) http://www.wind-works.org/FeedLaws/Great_Britain/DavidTokeAregreenelectricitycertificatesthewayforaward.doc (accessed 03/09/10) [50] Klessmann, C et al. Pros and cons of exposing renewables to electricity marker risks – A comparison of the market integration approaches in Germany, Spain and the UK, Energy Policy 36 (2008) p3656 [51] Ibid p3661 [52] Toke, D, Are electricity certificates the way forward for renewable energy? An evaluation of the UK's Renewables Obligation in the context of international comparisons (2005) http://www.wind-works.org/FeedLaws/Great_Britain/DavidTokeAregreenelectricitycertificatesthewayforaward.doc (accessed 03/09/10) [53] Ringel, M, Fostering the use of renewable energies in the European Union: the race between Feed-In tariffs and green certificates, Renewable Energy 31 (2006) p6 [54] DETI, The Northern Ireland Renewable Obligation – an outline of its operation http://www.detini.gov.uk/niro_-_how_it_works__2_.pdf (accessed 09/09/10) [55] Klessmann, C et al. Pros and cons of exposing renewables to electricity marker risks – A comparison of the market integration approaches in Germany, Spain and the UK, Energy Policy 36 (2008) p3646 [56] Fell, H-J (spokesperson on energy and technology policy for the Breen Parliamentary group in the German Bundestag) Feed-in Tariff for Renewable Energies: an effective stimulus package without New Public Borrowing [57] Diaz-Rainey, I et al. Stuck between a ROC and a hard place? Barriers to the take up of green energy in the UK, Energy Policy 36 (2008) p3054 [58] Friends of the Earth In defence of Feed-In tariffs: Friends of the Earth response to George Monbiot http://www.foe.co.uk/resource/briefings/monbiot_fits_response.pdf (accessed 09/09/10) [59] Couture, T. et al An analysis of Feed-In tariff remuneration models: Implications for renewable energy investment, Energy policy 38(2010) p959 [60] Ibid [61] Ibid [62] Europa, Summaries of European Legislation, Support for electricity from renewable energy sources http://europa.eu/legislation_summaries/energy/renewable_energy/l24452_en.htm (accessed 10/09/10) [63] Ibid [64] Agnolucci, G. The effect of financial constraints, technological progress and long-term contracts on tradable green certificates, Energy Policy (35) (2007) p3347 [65] Europa, Summaries of European Legislation, Support for electricity from renewable energy sources http://europa.eu/legislation_summaries/energy/renewable_energy/l24452_en.htm (accessed 10/09/10) Research and Library Service briefings are compiled for the benefit of MLA's and their support staff. Authors are available to discuss the contents of these papers with Members and their staff but cannot advise members of the general public. We do, however, welcome written evidence that relate to our papers and these should be sent to the Research & Library Service, Northern Ireland Assembly, Room 139, Parliament Buildings, Belfast BT4 3XX or e-mailed to RLS@niassembly.gov.uk
27 September 2010Aidan StennettRenewable generation data and policy within selected EU countriesNIAR 301-10The following paper compares the renewable energy development policies utilised in Denmark, Finland, Germany and the UK. The focus of the paper is 'newer' renewable technologies rather than large-scale hydro which have been ruled out as an option for Northern Ireland. Paper 301/10 27 September 2010 Key PointsA number of key themes emerge from the analysis below: Early moves to develop renewable policy and a long-term and stable approach financial incentives through robust Feed-in tariffs, local/SME, small-scale ownership and financial support of R&D are traits common to Demark and Germany's successful development of renewable energy. The UK has employed a variety of market based techniques to fund renewables growth. Such techniques, which offer variable revenue streams, have not stimulated the same levels of investor confidence that exists in regions operating a Feed-in tariff. The UK has also faced a major barrier in local opposition to renewable technologies. Finland's financial model – based on tax exemption and subsidy – has resulted in a less pronounced penetration of 'newer' renewable sources but the region has done so in a cost-effective manner. Other common aspects of the four regional policies examined are:
Executive SummaryThe following paper compares the renewable energy development policies utilised in Denmark, Finland, Germany and the UK. The focus of the paper is on 'newer' renewable technologies rather than large-scale hydro generation, which has been ruled out as an option for Northern Ireland. Key aspects of renewable development in Denmark include:
Significantly, Denmark's renewable energy policy has not been constant. In 2001 a change of government led to a radical change in policy and a free-market approach to financing the industry was adopted. The existing FIT made way for a market-dependent FIT. As a result of this the rate at which new wind turbines were installed slowed considerably. Such policy decisions have been, to an extent, reversed in the pursuit of 100% renewables target. The growth of renewables in Germany has had the following features:
Most recently Germany has committed to grid improvements and has introduced the introduction of the Heat Act, which outlines measures to secure 14% of renewables in the heating mix by 2020. Finland has adopted a different approach to renewable development. The region has opted for investment subsidies and tax incentives rather than a Feed-in tariff. The International Energy Agency has commented that whilst Finland's policy is typically targeted and limited in scale, their overall policy has been marked by a 'cost effective approach'. The growth of renewables in Finland is also unique amongst the regions examined as the region has access to significant amounts of large-scale hydro generation. The region has also developed nuclear power. Other key aspects of Finnish policy have included:
Looking forward, Finland plans to follow the lead of Denmark and Germany by introducing a Feed-in tariff from January 2011. The previous UK Government, Cambridge University's Electricity Policy Research Group and Greenpeace, have identified short-comings in UK environmental policy. In the case of the former, the 2008 White Paper on Energy recognised that current UK policy (at the time) would only secure 5% renewable penetration in the final energy consumption by 2020 – the UK target is 15%. Two key factors have been identified as contributing to the UK's failure to effectively exploit the renewable resources theoretically available to the region. Firstly, the literature suggests that the region's decision to utilise a market-dependent financial model to incentivise renewable energy – the Non-Fossil Fuel Obligation between 1990 -2002 and Renewable Obligation Certificates (ROC) from 2002 to present – are partially accountable for this under-exploitation. Both mechanisms have had a negative impact on investor confidence. The renewable obligation, in particular, has been criticised for displaying the following tendencies:
The second major barrier in the UK has been the ability to secure planning permission. This has been largely attributed to local objections to the environmental impacts of renewable technology – particularly their visual impact and the possible knock-on effect this may have on house prices and tourism. It has been suggested that the local ownership model that forms part of the Danish electricity system has helped to overcome such objections. By contrast, the UK financial support mechanism, which favours large-scale developers who can hedge increased risk, has not facilitated local-ownership. It has been argued that the recently introduced UK Feed-in tariff, which specifically targets microgeneration, may overcome this tendency. Other aspects of UK policy include:
The most recently introduced policy mechanisms include:
The Coalition Government's Programme for Government makes a number of renewable energy commitments, including an extension of the Feed-in tariff and the creation of a green investment bank. Contents1 Introduction 2 Renewable penetration 3 Denmark 4 Germany 5 Finland 6 United Kingdom 6.1 Renewable Electricity 6.2 The problem with planning 6.3 Other Policy Measures 7 Discussion Annex 1Figure 1: Share of renewable sources in final electricity consumption (2008) Figure 2: Renewable electricity shares in EU-27 and North Africa 32 Annex 2Table 1: Energy supply and renewables - OECD Europe and selected EU Countries (2009) Table 2: Installed renewable capacity by technology - OECD Europe and selected EU Countries (2008) Annex 3Table 3: Renewable share by technology - OECD Europe and selected EU Countries (2009) Annex 4Figure 3: Denmark's Electricity Infrastructure 1985 and 2009 1 Introduction The following paper compares the renewable energy development policies utilised in Denmark, Finland, Germany and the UK. The focus of the paper is 'newer' renewable technologies rather than large-scale hydro which have been ruled out as an option for Northern Ireland (in a 2003 Departmental commission PB Power assessment of Northern Ireland's renewable recourse). 2 Renewable penetration Figure 1 (see Annex 1) ranks EU countries by the total share of renewable energy in final electricity consumption for 2008. Based on this information the countries with the largest renewable penetration are Austria and Sweden. However, the figure, whilst not misleading, does not present the full picture. Both Austria and Sweden's renewables penetration include significant amounts of large-scale hydro generation. Hydropower is a legitimate renewable source and is included in the EU definition of renewables, which states: "energy from renewable sources" means renewable non-fossil energy sources: wind, solar, geothermal, wave, tidal, hydropower, biomass, landfill gas, sewage treatment plant gas and biogases.[1] However, from a Northern Ireland perspective, large-scale hydropower has proven to be historically problematic. In their 2003 assessment of Northern Ireland's renewable energy resource PB Power concluded: In Northern Ireland, attempts have been made over the past 50 years to build large-scale hydro projects. These, however, did not go ahead because of environmental constraints.[2] For the purposes of this paper, discussion will focus on those states whose renewable energy policy has centred upon 'newer' technology types. Figure 2 (Annex 2) presents the renewable energy mix of the EU-27 (along with North African nations, which form part of the source analysis). Of the regions outlined in the Figure it is evident that Denmark has the greatest penetration on renewables without the use of hydropower. Germany has also a large deployment of wind and biofuels, as well as a relatively small hydro source. For this reason, the paper looks at both the policy mechanisms utilised by both these regions. Ideally, Spain would have also been considered however, a shortage of material in English prevent this analysis. Finland's renewable development has also been examined. It is included for a number of reasons. Firstly, the region has complimented its hydro generation with a substantial amount of biofuel generation. Secondly, the mechanisms used to stimulate renewable development differ to those employed by Denmark and Germany. The fourth region examined in the paper is the UK. Its inclusion serves two purposes. It allows an assessment of the policy instruments that have had the largest impact on Northern Ireland's renewable development. Secondly, the region has a low level of renewable penetration despite a large theoretical, as such the UK represents an interesting case study, particularly when examined in parallel with the other regions. Tables 1, 2 and 3 (Annex 3), provide a further data on the penetration of renewables in each region examined.[3] Headline data from each region includes: Denmark:
Germany:
Finland
UK
3 Denmark The development of renewable energy in Denmark was instigated by the oil crisis of 1973. The region, at the time, was 100% dependent on energy imports[4], 95% of which came from imported oil and the remaining 5% from coal.[5] As such, securing future security of supply and ensuring self-sufficiency became major policy drivers. However, with nuclear power ruled out due to public pressure and no known fossil fuel or traditional hydro resources available, the remaining policy options were limited.[6] Under such circumstance, the development of alternative energy sources became a necessity. The policies developed in Denmark, coupled with oil and gas production from the North Sea, have transformed the region from an importer of energy, into a self-sufficient, net exporter of energy. The region also has the lowest energy consumption per unit of GDP and the highest contribution of electricity from new renewables in the EU. Furthermore, the Danish Island of Samso has achieved energy self-sufficency.[7] The development of renewable energy has led to a fundamental shift in Denmark's energy system – from a centralised fossil fuel generation, featuring a few large-scale generators, to decentralised renewables generation, typified by thousands of individual power producers (IPPs), with the energy supply side operating on a not for profit basis.[8] Figures 3 (Annex 4) illustrates this transformation. Two key factors have led to this transformation. Firstly, a shift towards combined heat and power (CHP) and district heating 'created the necessary infrastructure' to facilitate a decentralised, renewable energy system.[9] Secondly, financial incentives - including Feed-in Tariffs (FIT), investment subsidies and tax breaks – provided an impetus for renewable energy investment and opened up the possibility of investing to a wide range of actors.[10] The concept of district heating became part of Denmark's energy landscape during the 1950s, with the first district heating loops installed in the 1960s. Early examples of district heating were supplied by large CHP plants centralised in larger cities. From 1986/87 the Danish Energy Agency and the Steering Group for Renewable Energy implemented programmes to encourage the use of decentralised district heating, that is, they encouraged the development of locally owned community based heating networks supplied by smaller-scale, local CHP plants. During the 1990s a tariff system was introduced that offered a premium for power produced by local CHP plants if it was fed-into the national grid. All of which occurred in parallel with a moratorium on the building of coal fired plants (1990-97)[11] These local CHP plants were often powered by non-renewable energy – power supplies ranged from gas turbines, solid municipal waste and biomass. However, the steps taken to develop local CHP and district heating networks created a: … decentralised energy structure that later with modest invests [could] be changed to local renewable energy.[12] An additional benefit of this system is that: …CHP can be regulated within seconds or minutes while coal station need hours, local CHP matches well with the fluctuating solar and wind power[13]. Denmark's development of renewable generation has been assisted by the use of a FIT. The FIT, first introduced in 1993, obligated utility companies to purchase renewable energy at a specified rate – for wind this rate was equal to 85% of the final price paid by consumers. The FIT was not the only financial mechanism utilised by the region. Other policies, including direct subsidy and tax exemptions for private wind farm owners, a 30% investment subsidy and tax free generation up to 7,000kWh, complimented the FIT premium. At the same time, the Danish government invested heavily in research and development, and implemented a favourable planning regime to encourage participation in the wind turbine market.[14] Two factors are important here. Firstly, the government's choice of policy ensured a high degree of stability, both financial and administrative, which helped to encourage investors. Secondly, a favourable and predictable FIT, alongside the other policies, encouraged a wide range of investors to enter the market. The growth of independent power producers – community groups and farmers, for example – was a significant method of encouraging public support and acceptance of wind farms. As a Danish government report noted: The local environmental disadvantages can lead to a lack of public acceptance of wind farms. Local ownership wind turbines (local farmers, co-operatives or companies) can ensure local acceptance of projects.[15] In addition to the FIT, Denmark has operated a policy of open and guaranteed access to the grid. The policy requires Transmission System Operators (TSO) 'to finance, construct, interconnect, and operate the transformer stations and transmission and distribution infrastructure for renewable energy technologies'.[16] It is argued that such a policy has a number of advantages, namely it:
Interconnection, to the Nordic hydro based electricity systems in the North and to European continental mainland in the south, has had a significant role to play in enabling Denmark to integrate large amounts of wind generation into its electricity system. The intermittent nature of wind generation results in variable power flows. Large-scale swings in generating capacity, from zero to maximum capacity depending on weather conditions, can occur within a matter of hours. Cross-border interconnection allows the system to address these imbalances in supply – energy can be exported at times of oversupply and imported during lulls. This import/export mechanism is used to balance around 70% of wind power variability – with the remainder balanced through internal mechanisms, typically coal fired generation. However, with significant amounts of intermittent generation coming on-stream in neighbouring regions, it is expected that this balancing act will become increasingly difficult in the future.[18] In 1986, Denmark established the Riso Research Centre, a wind power test station to provide quality assurance of turbines sold to the public. There have been a number of benefits associated with this and the regions support of R&D in general. It has allowed the region to refine turbine and power-system designed, achieving cost reductions of 80% to produce 1kwh of wind power.[19] Moreover, the expertise developed through R&D has substantially benefitted the export market. Exports of Danish energy technology trebled between 1998 and 2008, reaching 11% of total exports.[20] The development of renewable energy in Denmark has occurred in parallel with a long-standing and successful energy efficiency policy. As a government document points out: Danish gross energy consumption in 2009 was at the same level as in 1972 despite an economic growth of more than 100 per cent over the same period. Denmark's energy efficiency programme has encouraged energy savings in both end use and the supply sector. Key features of the programme included:
The trajectory of renewable development in Denmark has not been one of constant growth. In 2001, a change of government led to a radical change in policy and a free-market approach to financing the industry was adopted. The existing FIT made way for a market-dependent FIT[22]; wind energy generators were paid the market price plus a premium (approximately 0.0013€/kWh). As a result of this the rate at which new wind turbines were installed slowed considerably. At the same time, funding for certain research projects was also cut, leading to uncertainty in the research and development sector.[23] Such policies have been reversed, to an extent, as the region pursues 100% renewables. FIT support for wind power increased in 2008. However, the overall FIT system has been criticised for being incoherent, with different technologies operating under different FIT schemes.[24] 2008 also saw the introduction of an Energy Agreement, which introduced a number of mechanisms to support renewable growth, including:
4 Germany The 1970s oil crisis also acted as a catalyst for German renewable development. Intitially policy focussed on research – prototype development and training were funded at increasing levels between 1974 (€10m) and 1982 ( €150m), funding levels then declined until 1986, to €82m.[25] 1986 proved to be a watershed year for the region. The Chernobyl disaster gave rise to strong anti-nuclear sentiments amongst the German public and, at the same time, the issue of climate change and the possibility of an impending climate disaster became rooted in the public consciousness. In the following year, the Chancellor identified climate change as the most significant environmental problem facing the region. A Commission on Preventive Measures to Protect the Earth's Atmosphere was setup; one of the Commission's first actions was to recommend a 30% reduction in 1987 Co2 and methane emission levels by 2005, with a target of 80% by 2050.[26] Examining the development of renewable energy in Germany, it is possible to identify two distinct periods: 1990 to 2000 was marked by the first steps to create a market for renewables and the introduction of the first Feed-in tariff; from 2000 onwards Renewable Energy Sources Act, created more favourable investment conditions by refining the FIT system. The creation of a market for renewables began with two initiatives in the early 1990s. The '1,000 roof programme', which ran from 1991 until 1995, provided successful applicants with a total of 70% of the investments cost for installing solar PV. A second programme subsidised the wind turbine investment of up to 100MW (later extended to 250MW) by paying €0.04/kWh to producers. The latter programme was enhanced by the Feed-in Tariff Law 1990. The FIT placed an obligation on utility companies to purchase all renewable energy produced at rates equivalent to 65% to 90% of the average retail price of electricity.[27] The introduction of a FIT had a number of impacts. It provided a degree of stability to the renewable electricity investment and in doing so, encouraged investment by smaller producers, leading, in turn, to the development of decentralised generation.[28] The FIT faced challenges from the large, supra-regional utilities companies. The basis of such challenges was not any perceived threat from the burgeoning decentralised market; rather it was a geographical imbalance inherent in the original law that was the cause of objection.[29] The FIT required utilities to pay a premium for all renewable electricity produced. The geographical spread of renewable sources in Germany meant that utility companies in certain regions were obliged to purchase more renewable electricity than others, for the simple reason that a stronger resource existed in their region and more renewable electricity was produced as a result. This imbalance was redressed in 2000 with the introduction of a compensation scheme to spread the cost of funding the FIT across all utilities firms equitably.[30] Other policies from this period that ran in conjunction with the FIT included:
The Renewable Energy Sources Act (2000) marks the beginning of a second wave of renewable development policy in Germany. The act was introduced with the aim of doubling renewable electricity production by 2010. The key measure of the act was to repeal the Feed-in Law 1990 replacing it with an improved FIT mechanism that feature fixed rates (as the opposed to the previous models percentage of final retail price system) for renewable electricity for twenty years.[31] It is significant that the reform of the FIT served to increase the revenue stability for renewable generators.[32] Other features of the new FIT tariff included favourable rates for offshore wind, solar PV and biomass, as well as a front loaded tariff structure whereby renewable generators were paid more in the earlier years of a project (when cost were higher) than in the later years.[33] The aim of the 2000 Act was to offer more favourable rates to offshore wind, small-scale hydro and biomass, as well as offering bonuses for innovative technologies.[34] As of 2005, payments under the FIT were approximately €4.4bn, providing 44Twh of renewable electricity.[35] It is argued that the German FIT model has been instrumental in the growth of renewable energy businesses in general and SMEs in particular: …the Renewable Energy Sources act has also brought about the development of a highly diverse set of actors. Many new businesses have been founded. This is due, in particular, to the fact that all the participants on the market have been able to obtain loans on account of the high degree of security for investors offered by rates of compensation that are set for 20 years.[36] (Emphasis added) The introduction of the FIT was one aspect of the 2000 Act. A second important aspect of the legislation was that it clarified the rules governing and the financing of grid access. Guaranteed grid access featured as part of the act, furthermore it enshrined into law: …the principle that the grid connection is to be paid for by the producer of eco-power, while the upgrading of the grid is to be paid for by the grid operator [TSO].[37] In addition, the possibility of disputes arising from grid operators passing on the cost of grid improvement to producers was avoided by the introduction of a clearing centre – a legal forum for dispute resolution.[38] The FIT, although significant, has not been the sole mechanism for renewable development in this period. A number of other policies have positively impacted growth:
Looking forward, Germany's current renewable policy includes:
5 Finland The context in which renewable energy has been developed in Finland differs from that of Denmark and Germany. Nuclear energy and hydro generation form substantial part of the energy mix. The region currently has four nuclear power plants in operation, with a fifth being built (two further plants have received planning permission for 2020).[44] Hydro, as is evident from Table 1, is the largest contributor to the region's renewable energy mix, contributing to 17.75% of total electricity supply in 2009. With regard to 'newer' renewable penetration, biomass contributes 11.58% to total electricity supply and 38.25% to total renewable electricity supply. The technology has been the focus of the region's renewables strategy.[45] Development of wind energy in the region, compared to other states, has had a relatively low impact. The technology only supplies 0.39% of total electricity supply and contributes to 1.27% of the total renewable energy mix. However, as is evidenced below, Finland's renewable electricity policy favours wind generation, offering great levels of subsidy and more attractive tax incentives. Biomass has been used as a fuel in Finland for centuries. However, after the Second World War its use declined. Again, the oil crisis of the 1970s provided the impetus for its revival, with Finland's first energy strategy to promote renewables published in 1979. Commenting on Finland's policies the IEA have stated that the region: …generally takes a cost-effective approach to renewables promotion, and most promotion policies are typically targeted and limited in scale.[46] As of 2007, total annual financial support for renewables was €85m.[47] Modern Finnish renewable policy has utilised two central drivers - investment subsidies and tax benefits. With regard to investment subsidies, in the case of renewable electricity, a company's construction cost of renewable plants is co-financed by the Finnish government - up to 40% for wind generation plants and up to 30% for other technologies (including combined heat and power).[48] In 2006, the major recipients of investment subsidies were wood burning biomass plants, receiving 60% of all subsidies. The same rules apply to renewable heat investment, the region has also operated a specific programme to subsidise renewable heating systems in residential buildings.[49] Energy-related taxation has had a central role in Finland. The region was the first country to place a tax on carbon emissions in January 1990 (The Netherlands, Sweden, Norway and Denmark quickly followed suit). The Finnish government imposes a tax on electricity suppliers for every kWh of electricity passed onto the consumer. Suppliers then receive a refund for every kWh of renewable electricity supplied – the rate for wind energy is set at 0.69 eurocents per kWh, for all other technologies the rate is 0.42 eurocents per kWh. The general structure of energy taxes for heat and transport has remained relatively unchanged since 1997. At present these fuels are taxed in relation to their carbon content, approximately €20 is paid for every tonne of C02 produced. Biofuel oil used in working machines or heating is exempted from the tax. Other policy drivers have included:
Looking forward, the Finnish government has plans to introduce a Feed-in tariff from January 2011. The tariff will apply to wind energy and biogas. The wind generation tariff is aimed at increasing the level of electricity produced by wind to 6TWh by 2020. Electricity producers using either technology will receive a FIT rate of €83.50 per MWh of renewable produced. An additional €50/MWh will be paid for electricity produced using biogas at a CHP plant.[53] It is intended that the FIT scheme will run for a 12 year period.[54] 6 United Kingdom The share of renewables in the UK's total primary energy supply (3.1%, 2009) is, when compared to the other regions examined, relatively low. This is despite a large theoretical renewable resource. For example, the UK wind resource is estimated to be capable of providing approximately 150TWh of electricity per year (100TWh hours offshore, 50TWh onshore). The total exploitable renewable resource in the UK could, it is estimated, provide 316TWh of electricity each year. By contrast, current renewable exploitation provided 24.53TWh in 2009 – 7.7% of potential renewable supply. This has led a study by the Electricity Policy Research Group at the University of Cambridge to label UK policy as a 'failure', stating: The UK is regarded as a country where the considerable potential for renewable energy, relative to other major European countries, has failed to be realised.[55] However, the paper attributes this failure to: …societal preferences and the available mechanisms for encouraging social acceptability [rather than] financial support mechanisms.[56] Greenpeace are critical of the UK's failure to exploit the resources available. They, however, argue that policy makers are responsible for this failure: To date, our government has largely bungled the development of renewable technologies. They've been held back and undermined by weak policy, indecision, obstacles and the threat of nuclear power. When heat and transport energy is included, the UK ranks near the bottom of the EU league table for renewables development. Only Belgium, Cyprus and Malta are worse…With proper support, renewables can - and must - form the heart of our energy system.[57] Perhaps most significantly, in 2007, a government White Paper on Energy – 'Meeting the Energy Challenge' – acknowledged that existing policies would achieve a 5% penetration of renewables in total energy by 2020. The UK's 2020 target is 15% renewables penetration in total energy consumption.[58] 6.1 Renewable ElectricityExamining the policies used to promote renewable energy, particularly renewable electricity, it is evident that since the 1990s the UK has utilised two main financial incentives – the Non-Fossil Fuel Obligation (NFFO) (1990-2002) and the Renewable Obligation Certificate (used from 2002 onwards). The NFFO (parallel arrangements applied in Scotland through the Scottish Renewable Obligation and in Northern Ireland through the Northern Ireland Non-Fossil Fuel Obligation) was originally intended to finance the development of nuclear energy but was extended to include renewables. The NFFO required the then Public Electricity Suppliers to purchase electricity from renewable generators at a fixed rate for a specified period of time (typically 15 years).[59] Significantly, not all renewable energy was sold under NFFO contracts, rather 'contracts were awarded to the most price-competitive schemes'.[60] Renewable generators not awarded contracts under NFFO sold the electricity produced at the wholesale market price. The costs of the NFFO were covered by the Fossil Fuels Levy, a levy placed on the retail price of electricity. The levy was originally set at 10%[61] but fell to 1% in England Scotland and Wales, and 3% in Northern Ireland.[62] According to Renewable UK, at the end of the NFFO period, the UK had over 60 operational wind farms, with a total installed capacity of 412MW.[63] A number of criticisms were levelled at the NFFO initiative, including:
The ROC scheme replaced NFFO in 2002. The ROC model is a quota based system that requires electricity suppliers to supply increasing amounts of electricity sourced from renewable generation.[64] In order to demonstrate that their obligations have been met suppliers must produce a Renewable Obligation Certificate (ROC) for every MWh of electricity they supply to Ofgem. Should they fail to produce the predetermined amount of ROCs, suppliers are required to pay a buy-out fee (in Northern Ireland this was £37.19 per MWh during 2009/10). The proceeds of this buy-out fee are redistributed amongst suppliers who have produced the required amount of ROCs in a particular period.[65] ROCs are issued, free of charge, to generators for every MWh of renewable electricity produced. These are then sold to suppliers as a separate entity to the electricity itself. This has the effect of creating two markets and two revenue streams for generators – the electricity market and the ROC market. ROCs act as a premium on top of the market price (spot price) of electricity, and as such act as an incentive to RE development by contributing to its cost. Demand, within ROC market, is stimulated by the legal requirement placed upon suppliers to produce an increasing number of certificates at the end of each obligation period.[66] The buy-out fee and redistribution mechanism serve as an extra incentive for suppliers to purchase and hold ROCs.[67]
Renewable electricity has also been supported through the climate change levy exemption, which places a £4.3MWh charge on all non-renewable electricity sources.[71] 6.2 The problem with planningPlanning issues have negatively impacted the development of renewable electricity and have had a particular effect on the of growth on onshore wind. The problem can be summarised as follows: There has been consistent evidence that gaining planning permission is a serious obstacle to the development of wind farms or more precisely that the costs of obtaining permission are often prohibitive in terms of imposed delays, negotiation costs and planning restrictions on the precise nature of the final investment.[72] During 2007, the average time for local and national planning decisions for onshore wind was 24 months, with an approval rate of 62%. Since 2007, 'attempts have been made to place obligations on local councils to set target levels of energy renewables for new developments'. The 2008 Planning Act enabled the setting up of Infrastructure Planning Commission to decide on onshore wind farms of more than 50MW.[73] Planning problems have arisen due to a conflict between land use and energy supply. The major local objections to wind farms have centred on their visual impact, and the possible knock-on effect this may have on house prices and tourism.[74] Evidence suggests that in cases where wind farm development has coincided with a community ownership model successful development has been achieved.[75] This corresponds to the experiences in Denmark where local ownership has been central to overcoming local objections to development.[76] However, under the NFFO and ROC financial mechanisms, the high risk of investment has tended to hamper the growth of this ownership model. Wind farm development in the UK has tended towards large power company dominance.[77] The introduction of the UK FIT (April 2010) (for more information on the UK FIT see NIAR 300/10), by concentrating on stimulating microgeneration should serve to increase levels of locally owned renewable generation[78] and in doing so, may serve to ease planning objections. The Department of Enterprise, Trade and Investment state in their Strategic Energy Framework 2010, that they will scope the costs and benefits of a FIT for Northern Ireland.[79] In addition to the UK FIT a consultation process on enhancing grid access has recently been included. Proposals arising from this process will ensure: …all prospective generators (whether embedded or directly connected) will be offered a Connect and Manage connection where works are required on the transmission system. Under a Connect and Manage offer, prospective generators will be guaranteed connection to the network once their 'enabling works' are complete.[80] Final legislation on this issue has yet to be passed, although, as of July 2010, the Secretary of State had 'commenced his statutory powers'.[81] 6.3 Other Policy MeasuresOther policy measures aimed at the promotion of renewables in the UK include:
The 2009 Renewable Energy Strategy made a commitment of £30bn in financial support for renewable heat and electricity up to 2020. Key incentives in the strategy include:
The Coalition Programme for Government makes a number of commitments with regard to renewable energy policy, including:
7 Discussion A number of key themes emerge from the above. Firstly, it is evident that both Denmark and Germany have long-standing renewable policies which have remained relatively stable for the last two decades. In comparison, UK policy since 1990 has utilised two main financial incentives (with a third introduced recently) and has, in comparison, been marked by uncertainty at policy level. Evidence suggests that the financial incentive a region employs has a significant impact on the effectiveness of its renewable energy policy. Denmark and Germany have used variations of the Feed-in tariff successfully. The Feed-in tariff, employed over a long period of time, facilitates revenue stability for investors and encourages growth by removing some of the risk from investing in relatively new technology types. The UK, by contrast, has employed a variety of market based techniques to fund renewables growth. Such techniques, which offer variable revenue streams, have not stimulated the same levels of confidence in investors. Denmark's move away from its successfully employed Feed-in tariff in the early 2000s and the subsequent stagnation in renewables growth reinforces the need for stability in approach and long-term vision. Finland's financial model – based on tax exemption and subsidy – has resulted in a less pronounced penetration of 'newer' renewable sources, but the region has done so in a cost-effective manner. Furthermore, the region has a significant amount of large-scale hydro on-stream, an advantage not afforded to either Denmark or Germany. The use of a Feed-in tariff in Denmark and to an extent in Germany has encouraged investment amongst small-scale producers in general, and amongst local community groups in particular. In Denmark this has been aided by the evolution of distributed heat and power to a decentralised electricity system. An electricity system that includes local ownership, it is argued, tends to encourage public acceptance of renewable technologies. As such these regions have avoided the major barrier to development experienced in the UK – local objections during the planning process. The recently introduced UK Feed-in tariff, with its focus on microgeneration, appears designed to redress this problem by encouraging smaller producers into the market. A key feature of renewable electricity policy in Denmark, Finland and Germany has been guaranteed grid access. All three regions have ensured grid connection for renewable producers, although, the cost of this policy is distributed differently in different regions. For example, in Denmark the cost of connection is borne by the Transmission System Operator, whereas, in Germany the producer pays. There are significant benefits to guaranteed grid access: it removes a specific barrier to market; and it improves interconnection. In the UK a consultation on gird access was carried out in March 2010. The consultation outlined proposals for an 'enduring regime for grid access', which will ensure guaranteed gird access under the Connect and Manage Scheme: Final legislation on this issue has yet to be passed, although, as of July 2010, the Secretary of State had 'commenced his statutory powers'.[94] Early adoption, expenditure on R&D and resulting technological advancements, as well as specific policy incentives, have stimulated the growth of a substantial export market in both Denmark and Germany. Other key aspects of the four regional policies outlined above include:
Annex 1Figure 1: Share of renewable sources in final electricity consumption (2008)
Figure 2: Renewable electricity shares in EU-27 and North Africa
Annex 2Table 1: Energy supply and renewables - OECD Europe and selected EU Countries (2009)[95]
Table 2: Installed renewable capacity by technology - OECD Europe and selected EU Countries (2008)[96]
Annex 3Table 3: Renewable share by technology - OECD Europe and selected EU Countries (2009)[97]
Annex 4Figure 3: Denmark's Electricity Infrastructure 1985 and 2009[98]
[1] European Commission (2008) Proposal for a Directive of the European Parliament and Council on the promotion of the use of energy from renewable source (2008/0016) http://ec.europa.eu/energy/climate_actions/doc/2008_res_directive_en.pdf (accessed 24/09/10) [2] PB Power, commissioned by DETI, A study into the economic renewable energy resource in Northern Ireland and the ability of the electricity network to accommodate renewable generation up to 2010 a report prepared by PB Power (2003) http://www.detini.gov.uk/downutildocc-2.pdf (accessed 06/08/10) [3] Figures for Organisation for Economic Co-operation and Development (OECD) Europe are also provided for comparative reason. It should be noted that the OECD Europe does not correspond to the EU-27 rather it is comprised of the countries in the EU-15 (Austria, Belgium, Denmark, Finland, France, Germany, Greece, Ireland, Italy, Luxembourg, the Netherlands, Portugal, Spain, Sweden and the United Kingdom) plus the Czech Republic, Hungary, Iceland, Norway, Poland, Slovak Republic, Switzerland, Turkey. Comparable figures for the EU-27 are not available. [4] Maegaard, P. Danish Renewable Energy Policy (Oct 2009) http://www.wind-works.org/coopwind/DanishRenewableEnergyPolicyAReview.html (accessed 13/09/09) [5] Danish Energy Agency, Energy Policy Statement 2010, http://www.ens.dk/Documents/Netboghandel_-_publikationer/2010/energypolicystatement2010.pdf (accessed 13/09/09) [6] Lipp, J Lessons for effective renewable electricity policy from Denmark, Germany and the United Kingdom Energy Policy 35 (2007) p5486 [7] The Independent, The little island and its big, green victory (November 2009) http://www.independent.co.uk/environment/climate-change/the-little-island-and-its-big-green-victory-1827638.html (accessed 27/09/10) [8] Maegaard, P. Danish Renewable Energy Policy (Oct 2009) http://www.wind-works.org/coopwind/DanishRenewableEnergyPolicyAReview.html (accessed 13/09/09) [9] Ibid [10] ipp, J Lessons for effective renewable electricity policy from Denmark, Germany and the United Kingdom Energy Policy 35 (2007) p5486 [11] Maegaard, P. Danish Renewable Energy Policy (Oct 2009) http://www.wind-works.org/coopwind/DanishRenewableEnergyPolicyAReview.html (accessed 13/09/09) [12] Ibid [13] Ibid [14] Lipp, J Lessons for effective renewable electricity policy from Denmark, Germany and the United Kingdom Energy Policy 35 (2007) p5486 [15] Toke, D, Are electricity certificates the way forward for renewable energy? An evaluation of the UK's Renewables Obligation in the context of international comparisons (2005) http://www.wind-works.org/FeedLaws/Great_Britain/DavidTokeAregreenelectricitycertificatesthewayforaward.doc (accessed 03/09/10) [16] Sovacool, B K, Is the Danish Renewable Energy Model Replicable? Scitizen 2008 http://scitizen.com/future-energies/is-the-danish-renewable-energy-model-replicable-_a-14-1765.html (17/09/10) [17] Ibid [18] Dang Trong, M, Wind power - Danish wind industry may need a new balancing act, Modern Power Systems (September 2009) http://www.allbusiness.com/energy-utilities/utilities-industry-electric-power-power/13036122-1.html (accessed 17/09/10) [19] Lipp, J Lessons for effective renewable electricity policy from Denmark, Germany and the United Kingdom Energy Policy 35 (2007) p5487 [20] Danish Energy Agency, Danish Energy policy 1970-2010 http://www.ens.dk/en-US/Info/news/Factsheet/Documents/DKEpol.pdf_engelsk_til_web.pdf (accessed 13/09/09) [21] Danish Energy Agency, Energy Policy Statement 2010, http://www.ens.dk/Documents/Netboghandel_-_publikationer/2010/energypolicystatement2010.pdf (accessed 13/09/09) [22] A certificate trading scheme (similar to the UK's Renewable Obligation Certificate incentive) was also planned, but abandoned until the market for certificates became more robust [23] Lipp, J Lessons for effective renewable electricity policy from Denmark, Germany and the United Kingdom Energy Policy 35 (2007) p5487 [24] Maegaard, P. Danish Renewable Energy Policy (Oct 2009) http://www.wind-works.org/coopwind/DanishRenewableEnergyPolicyAReview.html (accessed 13/09/09) [25] Lutz Mez, L Renewable energy policy in Germany – institutions and measures promoting a sustainable energy system (2004) http://www.worldfuturecouncil.org/fileadmin/user_upload/Miguel/FIT.HIstory.Metz.pdf (accessed 20/09/09) [26] Ibid [27] Ibid [28] Couture, T. et al An analysis of Feed-in tariff remuneration models: Implications for renewable energy investment, Energy policy 38(2010) p955 [29] Lutz Mez, L Renewable energy policy in Germany – institutions and measures promoting a sustainable energy system (2004) http://www.worldfuturecouncil.org/fileadmin/user_upload/Miguel/FIT.HIstory.Metz.pdf (accessed 20/09/09) [30] Ibid [31] Ibid [32] ell, H-J (spokesperson on energy and technology policy for the Breen Parliamentary group in the German Bundestag) Feed-in Tariff for Renewable Energies: an effective stimulus package without New Public Borrowing [33] I Lutz Mez, L Renewable energy policy in Germany – institutions and measures promoting a sustainable energy system (2004) http://www.worldfuturecouncil.org/fileadmin/user_upload/Miguel/FIT.HIstory.Metz.pdf (accessed 20/09/09) [34] Ibid [35] IEA Energy policies of IEA Countries – Germany, 2007 Review p69 [36] Fell, H-J (spokesperson on energy and technology policy for the Breen Parliamentary group in the German Bundestag) Feed-in Tariff for Renewable Energies: an effective stimulus package without New Public Borrowing [37] Ibid [38] Ibid [39] Ibid [40] Kohlhaas, M, Ecological tax reform in Germany from theory to policy, American Institute for Contemporary German Studies The Johns Hopkins University [41] IEA Energy policies of IEA Countries – Germany, 2007 Review p69 [42] German Energy Agency, Renewable Energies Export Initiative http://www.dena.de/en/topics/renewable-energies/projects/projekt/renewable-energies-export-initiative/ (accessed 21/09/10) [43] German Energy Agency, Grid II, http://www.dena.de/en/topics/renewable-energies/projects/projekt/grid-study-ii/ (accessed 21/09/10) [44] Bloomberg, Finland to Push for Renewable, Wind Energy With Feed-In Tariff Subsidies, (16/09/10) http://www.bloomberg.com/news/2010-09-16/finland-to-push-for-renewable-wind-energy-with-feed-in-tariff-subsidies.html (accessed 22/09/09) [45] IEA Renewable Information 2010 with 2009 data – Finland p192 OECD/IEA (2010) [46] IEA Energy Policies of IEA Countries- Finland 2007 http://www.iea.org/textbase/nppdf/free/2007/finland2007.pdf (accessed 22/09/10) [47] Ibid [48] European Commission, Directorate General for Energy and Transport, Finland Renewable Energy factsheet, (2008) http://www.energy.eu/renewables/factsheets/2008_res_sheet_finland_en.pdf (accessed 22/09/10) [49] EA Energy Policies of IEA Countries- Finland 2007 http://www.iea.org/textbase/nppdf/free/2007/finland2007.pdf (accessed 22/09/10) [50] European Commission, Directorate General for Energy and Transport, Finland Renewable Energy factsheet, (2008) http://www.energy.eu/renewables/factsheets/2008_res_sheet_finland_en.pdf (accessed 22/09/09) [51] EA Energy Policies of IEA Countries- Finland 2007 http://www.iea.org/textbase/nppdf/free/2007/finland2007.pdf (accessed 22/09/09) [52] Finnish Energy Industries District heating, http://www.energia.fi/en/districtheating/districtheating (accessed 22/09/09) [53] Bloomberg, Finland to Push for Renewable, Wind Energy With Feed-In Tariff Subsidies, (16/09/10) http://www.bloomberg.com/news/2010-09-16/finland-to-push-for-renewable-wind-energy-with-feed-in-tariff-subsidies.html (accessed 22/09/10) [54] The Finnish Wind Power Association , Current political issues in Finland, http://www.tuulivoimayhdistys.fi/in+english (accessed 22/09/10) [55] Pollitt, M G UK renewable Energy Policy since Privatisation (Electricity Policy Research Group Working Paper) Cambridge Working Paper IN Economics (2010) p1 [56] Ibid [57] Greenpeace UK Renewable Energy, http://www.greenpeace.org.uk/climate/solutions/renewable-energy (accessed 23/09/10) [58] EREC, UK renewable energy policy review (2009) http://www.erec.org/fileadmin/erec_docs/Projcet_Documents/RES2020/UK_RES_Policy_Review_09_Final.pdf (accessed 23/09/10) [59] Ofgem Non Fossil Fuels Obligation/Scottish Renewable Obligation http://www.ofgem.gov.uk/Sustainability/Environment/NFFOSRO/Pages/NFFOSRO.aspx (accessed 23/09/10) [60] Department of Trade and Industry (achieved), A summary of the experience of wind energy support through the NFFO – Wind energy fact sheet 6 http://webarchive.nationalarchives.gov.uk/tna/+/http://www.dti.gov.uk/renewables/publications/pdfs/windfs6.pdf/ (accessed 23/09/10) [61] Renewable UK, History of NFFO http://www.bwea.com/ref/nffo.html (accessed 23/09/10) [62] Department of Trade and Industry (achieved), A summary of the experience of wind energy support through the NFFO – Wind energy fact sheet 6 http://webarchive.nationalarchives.gov.uk/tna/+/http://www.dti.gov.uk/renewables/publications/pdfs/windfs6.pdf/ (accessed 23/09/10) [63] Renewable UK, History of NFFO http://www.bwea.com/ref/nffo.html (accessed 23/09/10) [65] DETI, The Northern Ireland Renewable Obligation – an outline of its operation http://www.detini.gov.uk/niro_-_how_it_works__2_.pdf (accessed 09/09/10) [66] Held, A et al, On the success of policy strategies for the promotion of electricity from renewable energy sources in the EU http://eeg.tuwien.ac.at/eeg.tuwien.ac.at_pages/publications/pdf/HAA_PAP_2006_1.pdf (accessed 03/09/10) [67] Klessmann, C et al. Pros and cons of exposing renewables to electricity marker risks – A comparison of the market integration approaches in Germany, Spain and the UK, Energy Policy 36 (2008) p3654 [68] Ibid [69] Department of Energy and Climate Change, The Renewable Energy Strategy 2009, (available for download) http://www.decc.gov.uk/en/content/cms/what_we_do/uk_supply/energy_mix/renewable/res/res.aspx (accessed 23/09/10) [70] Pollitt, M G UK renewable Energy Policy since Privatisation (Electricity Policy Research Group Working Paper) Cambridge Working Paper IN Economics (2010) p21 [71] EREC, UK renewable energy policy review (2009) http://www.erec.org/fileadmin/erec_docs/Projcet_Documents/RES2020/UK_RES_Policy_Review_09_Final.pdf (accessed 23/09/10) [72] Pollitt, M G UK renewable Energy Policy since Privatisation (Electricity Policy Research Group Working Paper) Cambridge Working Paper IN Economics (2010) p30 [73] Ibid [74] Ibid p31 [75] Ibid p32 [76] Toke, D, Are electricity certificates the way forward for renewable energy? An evaluation of the UK's Renewables Obligation in the context of international comparisons (2005) http://www.wind-works.org/FeedLaws/Great_Britain/DavidTokeAregreenelectricitycertificatesthewayforaward.doc (accessed 03/09/10) [77] Ibid [78] Pollitt, M G UK renewable Energy Policy since Privatisation (Electricity Policy Research Group Working Paper) Cambridge Working Paper IN Economics (2010) p33 [79] DETI, Strategic Energy Framework 2010 http://www.detini.gov.uk/strategic_energy_framework__sef_2010_.pdf (accessed 27/09/10) [80] Department of Energy and Climate Change, Government Response to the technical consultation on the model for improving grid access (July 2010) http://www.decc.gov.uk/assets/decc/Consultations/Improving_Grid_Access/251-govt-response-grid-access.pdf (accessed27/09/10) [81] Ibid [82] DEFRA, The UK energy efficiency action plan (2007) [83] Pollitt, M G UK renewable Energy Policy since Privatisation (Electricity Policy Research Group Working Paper) Cambridge Working Paper IN Economics (2010) p25 [84] Energy Technologies Institute, Delivering low carbon energy technologies and supporting economic growth (August 2010) http://www.energytechnologies.co.uk/Uploads/RelatedDocsThumbnails/eti-brief-august-2010.pdf (accessed 27/09/10) [85] Ibid [86] UK Biofuels situation http://www.hgca.com/publications/documents/UK_Biofuel_situation.pdf (accessed 24/09/10) [87] HM Treasury, Pre-budget report 2009 – Chapter 7 Supporting Low-Carbon Growth (December 2009) http://webarchive.nationalarchives.gov.uk/20100407010852/http://www.hm-treasury.gov.uk/d/pbr09_chapter7.pdf (accessed 24/09/10) [88] HM Revenue and Customs Budget 22 June 2010 – Excise Duties and Environmental Taxes (2010) http://www.hmrc.gov.uk/budget2010/excise-all.pdf (accessed 24/09/10) [89] EREC, UK renewable energy policy review (2009) http://www.erec.org/fileadmin/erec_docs/Projcet_Documents/RES2020/UK_RES_Policy_Review_09_Final.pdf (accessed 23/09/10) [90] Ibid [91] Department of Energy and Climate Change Bio-energy grants scheme http://www.decc.gov.uk/en/content/cms/what_we_do/lc_uk/lc_business/lc_economy/env_trans_fund/bio_grants/bio_grants.aspx (accessed 24/09/10) [92] EREC, UK renewable energy policy review (2009) http://www.erec.org/fileadmin/erec_docs/Projcet_Documents/RES2020/UK_RES_Policy_Review_09_Final.pdf (accessed 23/09/10) [93] The Guardian Government admits marine power fund has run aground (19 July 2009) http://www.guardian.co.uk/business/2009/jul/19/utilities-energy-marine-power-uk (accessed 24/09/10) [94] Ibid [95] International Energy Agency/OECD Renewables Information 2010 [96] Ibid [97] Ibid [98] The Danish Energy Agency, Energy Info and maps, http://www.ens.dk/en-US/Info/FactsAndFigures/EnergyInfoMaps/Sider/Forside.aspx (accessed 15/09/10) Research and Library Service briefings are compiled for the benefit of MLA's and their support staff. Authors are available to discuss the contents of these papers with Members and their staff but cannot advise members of the general public. We do, however, welcome written evidence that relate to our papers and these should be sent to the Research & Library Service, Northern Ireland Assembly, Room 139, Parliament Buildings, Belfast BT4 3XX or e-mailed to RLS@niassembly.gov.uk
30 September 2010NIAR 302-10Aidan StennettThe Energy Act 20101 Introduction The Energy Act 2010 (The Act) came into force on 8 April 2010, taking forward policies first proposed in the UK Low Carbon Transition Plan 2009 (The Transition Plan). The Transition Plan sets out policy mechanisms which aim to reduce UK carbon emission levels by 18% on 2008 levels by 2020. The Act, which extends to England, Scotland and Wales[1], has four main elements, it introduces:
As well as:
The following paper provides an outline of each of these measures and background information. 2 The Carbon Capture and Storage Incentive Carbon Capture and Storage (CCS) is a three part process that consists of:
The purpose of the technology is to reduce carbon emissions from large-point sources such as coal-fired power plants. CCS has not yet reached commercial viability. However, as of June 2010, there were 80 large-scale demonstration projects in various stages of development around the world. Five large-scale demonstration projects are currently in operation in Algeria, Norway (two projects) and the USA (two projects).[4] The Act sets out a framework for the introduction of a CCS incentive, aimed at placing the UK 'at the forefront of global efforts to develop CCS', by creating the conditions to deliver: The demonstration of up to four commercial scale CCS projects and, potentially, up to four fully-CCS capable coal-fired power stations by 2025.[5] Aspirations towards CCS commercial scale development are based upon the assumption that coal will continue to provide a vital part of the UK's energy mix, particularly if it becomes possible to substantially reduce its carbon emissions. Coal, although 'reliable [and] low cost, with abundant remaining reserves', has the highest level of carbon emissions of all fuels.[6] Funding has already being awarded to E.ON and Scottish Power for CCS design and development studies based at Kingsnorth (Medway Estuary, England) and Longannet (Fife, Scotland) respectively.[7] Specifically, the Act contains provisions that: …give the Government powers to introduce secondary legislation that will provide the detailed arrangements underpinning the levy and govern the disbursal of funds to CCS projects.[8] In effect, the act provides the Government with the power to introduce secondary legislation that will:
In addition, the Act requires that the government publishes a report every three years, detailing the progress 'made on the decarbonisation of electricity generation', and the 'development and use of CCS'.[10] The form of the proposed funding mechanisms and the secondary legislation is to be the subject of a formal consultation process. This was initially planned for summer 2010, with the tabling of legislation planned for autumn of the same year.[11] On 8 July 2010, however, an informal consultation document, the Market Sounding for CCS Demonstration Programme Projects 2-4, was released. The document is 'intended to help the Department to explore workable options for the CCS demonstration project selection and funding processes'.[12] The market sounding process sought comment from industry on a number of points:
The closing date for responses to was the 15 September 2010. At the time of writing, a response from the Government has not been published. A formal call for proposals is planned for the end of 2010.[14] Significantly, the scoping document states: As with any long-term, high-value funding proposal, final funding approval will be subject to the current Spending Review/[15] 3 Mandatory social price support The Act provides the Government with the power to introduce 'one or more schemes for the purpose of reducing fuel poverty'.[16] Significantly this includes introducing a scheme which offers lower prices to vulnerable customers.[17] In addition, the Act enables the Government to set up a 'reconciliation mechanism' to spread the cost of schemes across suppliers to ensure no company is 'disadvantage as a result of having higher numbers of customers who are deemed as eligible for social price support'.[18] The Act does not specify the details of the support schemes. Such details are to be defined through a formal consultation process. The initial timetable for consultation was summer 2010, with secondary legislation expected in early 2011.[19] At the time of writing the consultation has not been released.[20] The Committee for Energy and Climate Change's Fifth Report on Fuel Poverty (March 2010), states: The Government has said it will require suppliers to make available £300m annually by 2013-14 for support to vulnerable and low income customers...[21] The report also notes that the Government was: …minded that a significant proportion of the new resources made available through the mandated scheme will be focused on older pensioner households on the lowest incomes, and that some additional support will be available for other households vulnerable to fuel poverty. Support would be offered in the form of a fixed sum off the household electricity bill.[22] 4 Ofgem's principal objective The Act amends the sections in the Gas Act 1986 and Electricity Act 1989 that set out Ofgem's general duties. In this respect the Act requires Ofgem to: Ensure that the interests of all consumers, future and present, are taken into account when decisions are made in relation gas and electricity markets. This includes ensuring that the long term issues of tackling climate change and energy security are fully considered alongside the cost to current and future consumers.[23] This effectively alters Ofgem's remit, placing climate change and energy security on an equal footing to cost considerations. Furthermore, prior to the Act Ofgem's principle mechanism for ensuring consumer protection was the promotion of competition. The Act places an obligation on the authority to 'consider more direct measures to protect the consumer interest'.[24] The above changes came into force in June 2010. Since then, the Coalition Government has announced a review of Ofgem's role to 'explore whether any changes are needed to the regulatory framework to enable the Government to achieve its goals'. A call for evidence was issued on 27 July 2010. The closing date for evidence has since passed (24 September). At the time of writing the outcome of this exercise has yet to be published.[25] Northern IrelandIn Northern Ireland consideration of environmental sustainability and security supply forms part of the Authority's legislative objectives. It is, however, subject to the meeting of the principal objective. The Energy (Northern Ireland) Order 2003 states that: The principal objective of the Department and the Authority in carrying out their respective electricity functions is to protect the interests of consumers of electricity supplied by authorised suppliers, wherever appropriate by promoting effective competition between persons engaged in, or in commercial activities connected with, the generation, transmission or supply of electricity.[26] It adds: The principal objective of the Department and the Authority in carrying out their respective gas functions is to promote the development and maintenance of an efficient, economic and co-ordinated gas industry in Northern Ireland.[27] In meeting its principle objective for electricity, Section 12(1) of the 2003 Order states that the Authority must have 'regard' for:
In meeting its principle objective for gas, Section 14(2) of the 2003 Order states that the Authority must have 'regard' for:
In both cases (see Section 12(5) and Section 14(5) of the 2003 Order), the Energy Order places a subsequent requirement on the Authority to carry out its functions 'in the manner which it considers is best calculated': …to secure a diverse, viable and environmentally sustainable long-term energy supply.[30] 5 Tackling market power exploitation Market arrangements in Great Britain entitle generation companies to operate power stations without taking into account network limitations. However, in some areas insufficient wire capacity places a limit the amount of electricity that can flow between certain locations – these are known as areas of constraint. To address this situation, the system operator is required to balance supply and demand on 'both sides of such constraints'.[31] Ofgem balances supply and demand by accepting 'offers to increase generation' and 'bids to reduce generation' from specific plants.[32] Bids refer to the price generators are willing to pay the system operator reduce generation or increase consumption by certain volume. Offers refer to the price generators are willing to charge the system operator to increase generation or reduce consumption.[33] Exploitation occurs when the generator utilises its market power to secure an excessively high price for increasing generation or an excessively low price for decreasing generation.[34] For example, a generator might secure an excessively low price for decreasing generation as a result of being the only producer in a particular location available to reduce output, which, therefore, enables them to name their bid price.[35] Commenting on the issue, Ofgem have stated: The direct and indirect costs of any undue exploitation of market power are likely to be borne by GB consumers in terms of increased retail bills. In the longer run the impact on consumers would be greater if the undue exploitation of market power was to have the effect of deterring new entrants and reducing the competitiveness of the market.[36] Furthermore: Any undue exploitation of market power will make wholesale electricity more expensive and have a detrimental effect on the competitiveness of the wholesale market. For example, there may be a negative impact on investment and new entry and a lack of confidence in the ability of prices to reflect market conditions which could lead to reduced liquidity. These factors could increase the price of wholesale electricity still further over time. The resultant costs of all these effects are likely to be borne by consumers in terms of increased retail bills.[37] The Act provides the Government with the power to insert a new licence condition into electricity generation licences that will give Ofgem additional powers to tackle such abuses. The Act also provides that generators, subject to an enforcement order under the terms of the new licence condition, are entitled to appeal to the Competition Appeal Tribunal.[38] A consultation on the detailed licence condition was expected to take place during the summer 2010, enabling it to be operational by the first quarter of 2011 (subject to Parliamentary scrutiny).[39] At the time of writing, the consultation document has not been published.[40] 6 Other aspects of the Act In addition to the above the Act introduces clauses which enable the Government to set the period within which energy companies must inform customers of changes to their gas and electricity tariffs. The current 65 working day period has been deemed 'unacceptable'.[41] In addition the Act allows the Government to extend the time limit within which Ofgem can impose financial penalties on energy suppliers for breaches of licence conditions from 12 months to five years.[42] Finally, the Act introduces reserve powers that the Government may use to address any disadvantage to consumers caused by cross subsidy. In the period 2005 to 2007 suppliers earned higher margins from electricity supply than often lower than those earned through gas supply. Ofgem has identified incidents were suppliers, offering both gas and electricity, have cross-subsidised their gas business from their electricity business. Higher electricity price effectively pay for lower gas prices. This situation negatively impacts electricity only customers (of such suppliers) who experience higher electricity prices but do not benefit from a subsidised gas supply.[43] [1] The Energy Act 2010 s37 http://www.legislation.gov.uk/ukpga/2010/27/pdfs/ukpga_20100027_en.pdf (accessed 28/09/10) [2] Department of Energy and Climate Change, Energy Bill Factsheets: Summary (2010) http://www.decc.gov.uk/assets/decc/legislation/energybill/1_20100226093333_e_@@_energybillfactsheetsummary.pdf (accessed 28/09/10) [3] Department of Energy and Climate Change, Office of Climate Capture and Storage http://www.decc.gov.uk/en/content/cms/what_we_do/uk_supply/energy_mix/ccs/occs/occs.aspx (accessed 28/09/10) [4] IEA/CSLF Report to the Muskoka 2010 G8 Summit, Carbon Capture and Storage Progress and Next Steps (June 2010) http://www.iea.org/papers/2010/ccs_g8.pdf (accessed 28/09/10) [5] Department of Energy and Climate Change, Energy Bill Factsheets: Carbon Capture and Storage Incentive http://www.decc.gov.uk/assets/decc/legislation/energybill/1_20091215163644_e_@@_ccsfactsheet.pdf (accessed 28/09/10) [6] Ibid [7] Department of Energy and Climate Change, Carbon Capture and Storage (CCS) http://www.decc.gov.uk/en/content/cms/what_we_do/uk_supply/energy_mix/ccs/ccs.aspx (accessed 29/09/10) [8] Department of Energy and Climate Change, Energy Bill Factsheets: Carbon Capture and Storage Incentive http://www.decc.gov.uk/assets/decc/legislation/energybill/1_20091215163644_e_@@_ccsfactsheet.pdf (accessed 28/09/10) [9] Ibid [11] Ibid [12] Department for Energy and Climate Change, Market Sounding for CCS Demonstration Programme Projects 2-4, http://www.decc.gov.uk/en/content/cms/consultations/mktsound_ccs/mktsound_ccs.aspx (accessed 28/09/10) [13] Ibid [14] Ibid [15] Ibid [16] The Energy Act 2010 s9(1) http://www.legislation.gov.uk/ukpga/2010/27/pdfs/ukpga_20100027_en.pdf (accessed 28/09/10) [17] Ibid s9(8b) [18] Department of Energy and Climate Change, Energy Bill Factsheets: Mandatory Social Price Support http://www.decc.gov.uk/assets/decc/legislation/energybill/1_20091123124616_e_@@_energybillfactsheet2.pdf (accessed 28/09/10) [19] Ibid [20] See DECC Consultations http://www.decc.gov.uk/en/content/cms/consultations/consultations.aspx (accessed 29/09/10) [21] House of Commons Energy and Climate Change Committee , Fuel Poverty Fifth Report of Session 2009–10 Volume I (30 March 2010) http://www.publications.parliament.uk/pa/cm200910/cmselect/cmenergy/424/424i.pdf (accessed 29/09/10) [22] Ibid [23] Ibid [24] Ibid [25] Department of Energy and Climate Change, Ofgem review: Call for evidence http://www.decc.gov.uk/en/content/cms/consultations/ofgem_review/ofgem_review.aspx (accessed 29/09/10) [26] The Energy (Northern Ireland) 2003 s12(1) [27] Ibid s14(1) [28] Ibid s12(2c) [29] Ibid s14(2c) [30] Ibid s12(5) and s14(5) [31] Department of Energy and Climate Change, Energy Bill Factsheets: Market Power Licence Condition http://www.decc.gov.uk/assets/decc/legislation/energybill/1_20091119093624_e_@@_energybillfactsheet4.pdf (accessed 29/09/10) [32] Ibid [33] Ofgem, Addressing Market Power Concerns in the Electricity Wholesale Sector - Initial Policy Proposals (March 2009) http://www.ofgem.gov.uk/Markets/WhlMkts/CompandEff/Documents1/Market_Power_Concerns-_Initial_Policy_Proposals.pdf (accessed 29/09/10) [34] The Energy Act 2010 s18( 4-6) http://www.legislation.gov.uk/ukpga/2010/27/pdfs/ukpga_20100027_en.pdf (accessed 28/09/10) [35] Ofgem, Addressing Market Power Concerns in the Electricity Wholesale Sector - Initial Policy Proposals (March 2009) http://www.ofgem.gov.uk/Markets/WhlMkts/CompandEff/Documents1/Market_Power_Concerns-_Initial_Policy_Proposals.pdf (accessed 29/09/10) [36] Ibid [37] Ibid [38] Department of Energy and Climate Change, Energy Bill Factsheets: Market Power Licence Condition http://www.decc.gov.uk/assets/decc/legislation/energybill/1_20091119093624_e_@@_energybillfactsheet4.pdf (accessed 29/09/10) [39] Ibid [40] See DECC Consultations http://www.decc.gov.uk/en/content/cms/consultations/consultations.aspx (accessed 29/09/10) [41] Department of Energy and Climate Change, Energy Bill Factsheets: Summary http://www.decc.gov.uk/assets/decc/legislation/energybill/1_20100226093333_e_@@_energybillfactsheetsummary.pdf (accessed 28/09/10) [42] Ibid [43] Department of Energy and Climate Change, Energy Bill Factsheets: Reserve power for the adjustment of energy charges http://www.decc.gov.uk/assets/decc/legislation/energybill/1_20091119093645_e_@@_energybillfactsheet6.pdf (accessed 29/09/10)
01 November 2010NIAR 416-10Aidan StennettNIE Distribution Code1 Introduction The Northern Ireland Electricity (NIE) Distribution Code (the Code) outlines the 'principles and procedures governing the Distribution Network Operators relationship with all users of the distribution system, be they generators, suppliers or demand customers'.[1] It is a largely technical document that sets out the day-to-day planning and operational procedures. The Code was published in May 2010 after a consultation process. The Distribution Code is distinct from the Grid Code. The latter code refers to the transmission network. The two codes had previously been combined. However, the introduction of the Single Electricity Market and EC's Internal Market Direction required NIE to separate out the operation of the Distribution System from the Transmission System.[2] To clarify, 'distribution system' refers to the electrical lines which connect plants, apparatus or meters with the intention of distributing electricity, whereas the transmission system refers to the high voltage cable lines that transmit electricity from one power station to another or between substations.[3] The Distribution Network Operator referred to above and elsewhere in this paper is NIE. The Code, and its relation to renewable generation, was brought to the attention of the Committee for Enterprise, Trade and Investment via a submission to its inquiry into renewable energy by the partners involved in the NPP, MicrE and NPP SMALLEST projects. The submission highlighted the communications requirements introduced in the Code and the associated cost. The focus of this paper is on these aspects of the cost. However, the paper also outlines the specific technical clauses that renewable generators should adhere to in order to be compliant with the Code. 2 Communication Specifications The Code requires that:
The rationale behind the telephone line requirement is to facilitate communication between the DNO and generator. Communication can be either over the telephone or via electronic mail. In either case, the facility to permanently record instruction and communication must be in place. This applies to both ends of the line (i.e. at the DNO end and the Generator end).[4] SCADA is a system of hardware and software that enables DNOs to collate and monitor data across a distributed network from a central location and to issue management information and alerts, which ensure controls are consistently adhered to and production is constantly maintained.[5] NIE have estimated that the cost of communication solutions (including SCADA) will be £20,000. Correspondence with NIE confirms that this figure will include the cost of:
NIE state that developers should make provision for this when budgeting for a grid connection. The wording around communication solutions is notable. NIE state: NIE is investigating the communications solution to generators and this cost will be included in future connection offers, where necessary.[7] (Emphasis added) The above implies that work is ongoing on final design of the communications solution. How close the estimated cost is to the final actual cost will be determined by the result of these investigations. Generator responsibilities with regard to SCADA are set out in section 7.10 of the Connection Conditions subdivision of the Code. The Code states that the following generating units should conform to SCADA requirements:
The second criteria – generating units within an output of 100kW or more up to 1MW – is likely to include relatively small-scale generators. The Code does not define the 'local network conditions' that would result in such levels of generation needing to install a SCADA system and how the cost might be affected. The Committee may wish to pursue this as a line of questioning. 3 Technical Generation Specification The majority of the Code's requirements are of a technical nature. The purpose of this section is to provide a basic definition of some of these technical specifications. The specifications themselves are outlined in Annex 1 (the Annex has been sourced from NIE guidance that is provided to renewable generators connecting to the grid). Reactive power capability: reactive power refers to the rate at which a reactive component stores energy in its magnetic field. Most equipment will connected to an electricity system will produce and absorb reactive power. The Distribution Network Operator (DNO) must control these power flows to ensure the power system operates within appropriate voltage limits.[9] The Code requires that all generating units must operate within certain power factor ranges to ensure stability. Generating Unit Control Arrangements: these arrangements require that all generating units must be fitted with a control system capable of switching between voltage control and power factor control. Each generation unit's voltage bands are specified in its Connection Agreement. Variations in System Frequency: system frequency is defined as 'a continuously changing variable that is determined and controlled by the second-by-second (real time) balance between system demand and total generation'. When demand is greater than generation frequency falls, and when generation is greater than demand frequency rises. The DNO is obligated to control frequency within specified limits.[10] The Code defines these limits for all generating plants with an output of 100kW or more. Voltage control: the exact voltage on the network varies at any one time according to supply and demand. As such the voltage must be monitored and controlled to ensure it is maintained within acceptable limits.[11] Issues relating to this area include voltage variations, voltage unbalance and harmonic content. Annex 1[12]
[1] NIE Distribution Code May 2010 http://www.nie.co.uk/suppliers/pdfs/Distribution_Code_1_May_2010.pdf [2] NIE Distribution Code http://www.nie.co.uk/suppliers/distribution.htm (accessed 28/10/10) [3] NIE Distribution Code – glossary of terms http://www.nie.co.uk/suppliers/pdfs/Distribution_Code_1_May_2010.pdf pp201-220 [4] NIE Distribution Code s7.3 May 2010 http://www.nie.co.uk/suppliers/pdfs/Distribution_Code_1_May_2010.pdf [5] NCC Group National Grid http://www.nccgroup.co.uk/clients/escrow-case-studies/national-grid.aspx (accessed 28/10/10) [6] From email Communication with NIE 26/10/10 [7] NIE Connecting Renewable Generation to the NI Electricity Network provided by email 26/10/10 [8] NIE Distribution Code 7.10 May 2010 http://www.nie.co.uk/suppliers/pdfs/Distribution_Code_1_May_2010.pdf [9] The National Grid Plc An Introduction to Reactive Power http://www.nationalgrid.com/NR/rdonlyres/43892106-1CC7-4BEF-A434-7359F155092B/3543/Reactive_Introduction_oct01.pdf (accessed 28/10/10) [10] The National Grid Plc Frequency Response http://www.nationalgrid.com/uk/Electricity/Balancing/services/frequencyresponse/ (accessed 28/10/10) [11] Parliament Office of Science and Technology – Post Note No163 UK Electricity Networks (October 2001) http://www.parliament.uk/documents/post/pn163.pdf (accessed 28/10/10) [12] Source NIE Connecting Renewable Generation to the NI Electricity Network provided by email 26/10/10
8 November 2010Aidan StennettRenewable Energy: PlanningNIAR 527-10Paper comparing planning regimes in the UK and the Paper 527/1008 November 2010Research and Library Service briefings are compiled for the benefit of MLA's and their support staff. Authors are available to discuss the contents of these papers with Members and their staff but cannot advise members of the general public. We do, however, welcome written evidence that relate to our papers and these should be sent to the Research & Library Service, Northern Ireland Assembly, Room 139, Parliament Buildings, Belfast BT4 3XX or e-mailed to RLS@niassembly.gov.uk Executive SummaryThe following paper compares planning regimes, as they relate to renewable energy development, in the UK and the Republic of Ireland. The paper addresses onshore development only. TimescalesData provided by the Department of the Environment Northern Ireland (DOENI) shows that the average time taken to grant approval for renewable projects (DOENI data refers to all projects irrespective of the technology developed) between 2006 and 2010 was155 workings days, approximately 6 months. Average yearly approval times were as follows:
In November 2010, Renewable UK published a comparative study which examined decision times (both approvals and refusals) for onshore wind. Please note, the Renewable UK report only include projects with a generation capacity of over 100kw. The figures provided by DOENI (above) include much smaller-scale generation projects. This accounts for the large differences in time-scales. A comparison of the two sets of data based on project capacity has not been possible as the figures provided by DOENI do not include capacity in all cases. The Renewable UK study yielded the following results; The UK average decision time during 2010 was 22.5 months, an increase on 2009 (20 months);
No such comparable data for the Republic of Ireland is recorded centrally. However, the statutory rules governing planning place timelines on the process. Local planning authorities have eight weeks, upon receipt of an application, to reach a decision. This is extended by four weeks should further information be required. Applicants have six weeks to submit any further information. Where a decision has not been provided within this eight or twelve week period, the planning authority is obliged to grant default permission to the project. The latest amendment to the regulations (The Planning and Development (Amendment) Act 2010), includes provisions in relation to default planning permission which gives local authorities a further 12 weeks to remedy any failure to make a decision. Default planning permission does not apply in cases where an Environmental Impact Assessment is required. Planning FeesNorthern IrelandPlanning fees are set out in the the Planning (Fees) (Amendment) Regulations (Northern Ireland) 2010. Within the regulations, category 5 outlines specific fees for wind turbines. Fees are charged on a per hectare basis, with a cap on the maximum fee payable. The cost of planning for wind turbines and wind farms is £237 for each 0.1 hectare. The maximum price payable is £11,834. The inclusion of a specific category for wind energy is unique to Northern Ireland. A consultation on proposals to provide permitted development rights to small-scale solar, wind, hydro, biomass, combined heat and power, and heat pump generation, in a domestic and non-domestic setting closed on 22 January. No further update on progress could be located at the time of writing. EnglandFees are outlined in the in the Town and Country Planning (Fees for Application and Deemed Applications) (Amendment) (England) Regulations 2008. Domestic developments are charged under category 6 or category 7a. The details are as follows:
All non-domestic development is generally charged under category 5 - the erection, alteration or replacement of plant or machinery. The planning fees under this category are £335 for each 0.1 hectare up to 5 hectares, and over 5 hectares the cost is £16,565 plus an additional £100 for each 0.1 hectare up to a maximum of £250,000. In April 2008 permitted development rights were granted to small-scale solar panels, heat pumps, combined heat and power equipment and biomass systems. In November 2009 a consultation on proposals to grant permitted development rights to wind turbines and air pumps in a domestic setting. The consultation also included proposals to extend permitted rights to wind, solar, air, ground and water pumps, biomass and combined heat and power equipment in a non-domestic setting. As of September 2010 the Government were considering a number of technical and practical issues, but stated that they were 'aiming to resolve these (issues) and to make key announcements and legislative changes as soon as possible'. ScotlandScottish planning fees are outlined in the Town and Country Planning (Fees for Applications and Deemed Applications) (Scotland) Amendment Regulations 2010. Domestic developments are, as is the case in England, charged under Category 6 or category 7a. However, the specific, fees are different. The details are as follows:
Non-domestic development is covered by Category 5. The fees payable are £319 for each 0.1 hectare of the site area, subject to a maximum of £15,950. In Scotland, the following types of renewable energy development fall into the permitted development rights category in a domestic context
The Scottish Government 'are committed to bringing forward the permitted development rights (in a non-domestic context) by April 2011'. WalesIn Wales, planning fees are set out in the Town and Country Planning (Fees for Applications and Deemed Applications) (Amendment) (Wales) 2009. Domestic development falls under (again these categories replicate the corresponding regulations in England):
Non-domestic development falls under Category 5, the 'erection, alteration or replacement of plant or machinery'. Fees payable under this category are £335 per 0.1 hectare up to 5 hectares and £16,464 for developments over 5 hectares, with an additional £84 per hectare up to a maximum of £250,000. In 2009, changes to planning legislation in Wales granted permitted rights to the following technologies in a domestic context :
Republic of IrelandIt has not been possible to clarify under what section of the Republic of Ireland planning regulations renewable development projects are charged under. Correspondence with local authorities in the Republic of Ireland has led to the conclusion that application charges are decided on a case-by-case basis In the Republic of Ireland permitted generation rights apply in domestic, agricultural and business and commercial setting, in the case of the following technology types;
The Republic of Ireland is, to date, the only region to complete the extension of permitted development rights to a non-domestic context. Contents1 Introduction 2 Planning Timescales 2.1 UK 2.2 Republic of Ireland 3 Planning Fees 3.1 Northern Ireland 3.2 England 3.3 Scotland 3.4 Wales 3.5 Republic of Ireland Annex 1: Northern Ireland Permitted Development Annex 2: England – Permitted Development Annex 3: Scotland – Permitted Development Annex 4: Wales – Permitted Development Annex 5: Republic of Ireland – Permitted development Annex 6: Republic of Ireland – Fees 1 Introduction The following paper compares planning regimes, as they relate to renewable energy development, in the UK and the Republic of Ireland. Specifically, the paper compares the time taken to reach a decision on planning and the fees charged in each jurisdiction. Details of permitted developments (types of development that do not require planning permission) are also included for each region. The paper addresses onshore development only. 2 Planning Timescales 2.1 UKData provided by the Department of the Environment Northern Ireland outlines the time taken to process approved renewable planning applications between 2006 and 2010. Over this period, the average time taken to approve renewable development projects in Northern Ireland was155 workings days, approximately 6 months (based upon 21 working days per month on average). Looking at individual years, the approval decision times were as follows:
The most recent comparative analysis of the planning process in the UK is the 'State of the Industry Report' (November 2010), compiled by Renewable UK. The report focuses on onshore wind development, providing planning decision timescales (including approvals and denials) for all four UK regions, as well as year on year trends. The data used to construct the report has been gathered from industry and covers the twelve months leading up to October 2010. Please note, the Renewable UK report only include projects with a generation capacity of over 100kw. The figures provided by DOENI (above) include much smaller-scale generation projects. This accounts for the large differences in time-scales. A comparison of the two sets of data based on project capacity has not been possible as the figures provided by DOENI do not include capacity in all cases. With regard to overall decision times, the UK average during 2010 was 22.5 months, an increase on 2009 (20 months). Between 2007 and 2009 decision times had decreased. There has, however, been an increase in the speed at which decisions are made at local authority level. The 16 month average timescale reported at the end of 2009 fell to 15 months in 2010. The key findings of the report's regional analysis are:
The report also provides an analysis of (non-appeal) approval rates for each region. The main results of which are as follows:
In all four regions a significant amount of wind energy capacity is in the planning process. The levels for each region are as follows:
2.2 Republic of IrelandNo such comparable data for the Republic of Ireland is recorded centrally. However, the statutory rules governing planning place timelines on the process. The planning process in the Republic of Ireland (as designated in the consolidated Planning and Development acts 2000 – 2007) is as follows:
Where a decision has not been provided within this eight or 12 week period, the planning authority is obliged to grant default permission to the project. The latest amendment to the regulations (The Planning and Development (Amendment) Act 2010), includes provision in relation to default planning permission which gives local authorities a further 12 weeks to remedy any failure to make a decision. Default planning permission does not apply in cases where an Environmental Impact Assessment is required.[4] With regard to appeals:
3 Planning Fees 3.1 Northern IrelandThe cost of securing planning permission in Northern Ireland is set out in the Planning (Fees) (Amendment) Regulations (Northern Ireland) 2010. Schedule 1, Part 2 of the Regulations outline fees payable for a number of development types. Category 5 sets out the planning fees for: The erection, alteration or replacement of plant and machinery including telecommunications/ data communications equipment, and single wind turbine and wind farms.[6] Fees are charged on a per hectare basis, with a cap on the maximum fee payable. The cost of planning for wind turbines and wind farms is £237 for each 0.1 hectare. The maximum price payable is £11,834.[7] This category is unique to Northern Ireland. Communication with the Department has indicated that the wording of this category, particularly the use of 'including', suggests the category does not represent an exhaustive list. As such, other types of renewable development are likely to be included within this fee band. At the time of writing, Research is awaiting final clarification on this point.[8] With regard to the appeals process, NI Direct advice states: All appeals, under the Planning (Northern Ireland) Order 1991 must be accompanied by a fee - currently £126.[9] The advice continues: The appeals process itself is free, however, you and the local planning authority normally have to pay your own expenses whether it is decided by the written procedure, a hearing or an inquiry. The overall cost will depend on whether you employ professional advisers or representatives. Sometimes, when there is a hearing or an inquiry, one party may be required to pay the other party's costs, as well as their own. The inspector will only do this if the person applying can show that the other side behaved unreasonably, and put them to unnecessary expense.[10] Permitted DevelopmentFollowing a period of consultation in 2007, DOENI issue a Draft Statutory Rule on permitted development rights for microgeneration in a domestic setting. The document outlines the context in which certain renewable development may go ahead without planning permission. The technologies covered are as follows (the proposed qualification criteria are outlined in Annex 1):
Subsequently the Department reopened the consultation in October 2009 to propose further changes to the Draft Statutory Ruling. The same consultation, 'Permitted development rights for microgeneration development', sets out further proposals to grant permitted development rights to the same technologies in a non-domestic setting.[11] The consultation ended on the 22 January 2010[12], no further update on progress is available. 3.2 EnglandIn England, planning fees are outlined in the Town and Country Planning (Fees for Application and Deemed Applications) (Amendment) (England) Regulations 2008. According to Communities and Local Government[13], three categories generally apply to renewable energy developments. Domestic developments are charge under category 6 or category 7a. The details are as follows:
Non-domestic development is generally charged under category 5 - the erection, alteration or replacement of plant or machinery. The planning fees under this category are £335 for each 0.1 hectare up to 5 hectares, over 5 hectares the cost is £16,565 plus an additional £100 for each 0.1 hectare up to a maximum of £250,000.[15] In certain circumstances, when none of the above apply developers may be charged under category 9 – 'the carrying out of any operations not coming within any of the above categories'. This category has two fee types. In the case of operations for the winning and working of minerals developers are charged £170 for every 0.1 hectare up to 15 hectares. Where the development exceeds 15 hectares the cost is £25,315 plus £100 for every additional hectare. The second category covers any other case. The charges under this sub-category are £170 for every 0.1 hectares up to a maximum of £250,000.[16] With regard to appeals, advice on the Direct Gov website notes that: The appeal process itself is free. However, you and the Local Planning Authority will have to pay your own expenses. If there is a hearing or an inquiry, one party may be asked to pay the other party's costs, as well as their own. The inspector will only do this if the person applying can show that the other side behaved unreasonably, and put them to unnecessary expense.[17] Permitted Development RightsIn April 2008 new rules on microgeneration brought certain categories of renewable generation into the category of permitted development. These changes enabled homeowners to install solar panels, heat pumps, combined heat and power equipment and biomass systems without the need to secure planning permission; subject to certain conditions (Annex 2 outlines these conditions).[18] Significantly, the regulations did not make provision for wind turbines or air source heat pumps. In November 2009 a consultation on proposals to grant permitted development rights to wind turbines and air pumps in a domestic setting was carried out. The consultation also outlined proposals to grant development rights to wind, solar, air, ground and water pumps, biomass and combined heat and power equipment in a non-domestic setting. Further permitted development proposals regarding anaerobic digestion, biomass and hydro-turbines were outlined for agricultural and forestry settings only. Again, these proposals were subject to specific criteria (outlined in Annex 2).[19] The consultation process closed on 9 February 2010. In answering a House of Commons question regarding the future of the proposals on 09 September 2010 the Minister for Communities and Local Government stated: The Government are committed to amending the Town and County Planning (General Permitted Development) Order 1995 to introduce permitted development rights for small-scale wind turbines and air source heat pumps, as part of our agenda to support renewable energy and low carbon technologies. There are a number of technical and practical issues that we are considering. We are aiming to resolve these, and to make key announcements and legislative changes as soon as possible.[20] (Emphasis added). At the time of writing no further announcements have been made. 3.3 ScotlandScottish planning fees are outlined in the Town and Country Planning (Fees for Applications and Deemed Applications) (Scotland) Amendment Regulations 2010.[21] As is the case with the corresponding regulations in England, renewable energy could potentially fall under one of a number of categories. Domestic developments are, as is the case in England, charged under Category 6 or category 7a. The specific, fees are however different. The details are as follows:
Category 10 also acts as a catch-all for developments not fitting into the above. The fees payable are as follows:
Permitted Development RightsIn Scotland, the following types of renewable energy development fall into the permitted development rights category in a domestic context (full details of qualifying criteria are outlined in Annex 3):
A consultation on proposals to extend these to non-domestic properties was launched on the 15 July 2010; the closing date for responses was 8 October 2010. The Scottish Government have stated that they 'are committed to bringing forward the permitted development rights by April 2011'.[28] 3.4 WalesIn Wales, planning fees are set out in the Town and Country Planning (Fees for Applications and Deemed Applications) (Amendment) (Wales) 2009. Again, as is the case with the above regions, renewable energy may potentially fall under a number of development categories. Domestic development falls under:
Category 9 again acts a catch all for development not fitting into these areas. The fees payable are:
Permitted development rightsIn 2009, changes to planning legislation in Wales granted permitted rights to certain types of domestic renewable microgeneration. Current permitted rights for domestic properties define microgeneration as:
The following technologies have been granted permitted rights for domestic use:
Within each of these categories, developments must meet certain criteria. A full list of such criteria is contained in Annex 4. 3.5 Republic of IrelandIt has not been possible to clarify under what section of the Republic of Ireland planning regulations renewable development projects are charged under. Correspondence with local authorities in the Republic of Ireland has led to the conclusion that application charges are decided on a case-by-case basis.[31] A complete list of potential charges (as outlined in the Planning and Development Regulations 2001) is outlined in Annex 6. Permitted generation rightsIn the Republic of Ireland permitted generation rights apply in domestic, agricultural and business and commercial setting, in the case of the following technology types;
In each case specific criteria must be met to qualify for permitted development status. These criteria are outlined in Annex 5. The Republic of Ireland is, to date, the only region to complete the extension of permitted development rights to a non-domestic context. Annex 1: Northern Ireland Permitted DevelopmentThe Planning (General Development) (Amendment) Order
|
|||||||||||||||||||||||||||||||||||||||||||||||||||||||||||||||||||||||||||||||||||||||||||||||||||||||||||||||||||||||||||||||||||||||||||||||||||||||||||||||||||||||||||||||||||||||||||||||||||||||||||||||||||||||||||||||||||||||||||||||||||||||||||||||||||||||||||||||||||||||||||||||||||||||||||||||||||||||||||||||||||||||||||||||||||||||||||||||||||||||||||||||||||||||||||||||||||||||||||||||||||||||||||||||||||||||||||||||||||||||||||||||||||||||||||||||||||||||||||||||||||||||||||||||||||||||||||||||||||||||||||||||||||||||||||||||||||||||||||||||||||||||||||||||||||||||||||||||||||||||||||||||||||||||||||||||||||||||||||||||||||||||||||||||||||||||||||||||||||||||||||||||||||||||||||||||||||||||||||||||||||||||||||||||||||||||||||||||||||||||||||||||||||||||||||||||||||||||||||||||||||||||||||||||||||||||||||||||||||||||||||||||||||||||||||||||||||||||||||||||||||||||||||||||||||||||||||||||||||||||||||||||||||||||||||||||||||||||||||||||||||||||||||||||||||||||||||||||||||||||
| Column 1 Class of Development | Column 2 Amount of fee | Column 3 Amount of Fee for Retention Permission |
| 1. The provision of a house. | €65. | €195, or €2.50 for each square metre of goss flor space for which permission is sought, whichever is the greater. |
| 2. (a) Any works for the carrying out of maintenance, improvement or other alteration of an existing house (including any works for the provision of an extension o the conversion for use as part of the house of any garage, store, shed or other structure). | €34 | €102, or €2.50 for each square metre of gross floor space for which permission is sought, whichever is the greater. |
| (b) Any other works, including the erectin, construction or alteration of structures, within or bounding the curtilage of an existinghouse, for purposes ancillary to the enjoyment of the house as such. | €34. | €102, or €2.50 for each square metre of gross floor space for which permission is sought whichever is the greater. |
| 3. The provision of buildings or other structures for the purposs of agriculture or the keeping of greyhounds. | (i) In the case of buildings, €80 for each building, or €1 for each square metre of gross floor space to be provide in excess of 50 square metres in the case of a building for the keeping of greyhounds or 20 square metres in any other case, whichever is the greater, | (i) In the case of buildings, €240 for each building, or €3 for each square metre of gross floor spaceto be provided in excess of 50 square metres in the case of a building for the keeping of gryhounds or 200 square metres in any other case, whichever is the greater, |
| (ii) in the case of any other structures, €80 for each structure, | (ii) in the case of any other structures, €240 for each structure, | |
| subject to a maximum of €300 | subject to a maximum of €900. | |
| 4. The provision of buildings other than buildings coming ithin class 1, 2 or 3. | €80 for each building, or €3.60 for each square metre of gross flor spce to be provided, whichever is the greater. | €240 for each building, or €10.80 for each square metre of gross floor space to be rovided, whichever is the greater. |
| 5. (a) The use of uncultivated land or semi-natural aras for intensive agriculturalpurposes. | €5 for each hectare of site area. | €15 for each hectare of site area. |
| (b) Initial fforestation. | €5 for each hectare of site area. | €15 for each hectare of site area. |
| (c) The replacement of broad-leaf high forest byconifer species. | €80, or €5 for each hectae of site area, whichever is the greater. | €240, or €15 for each hectare of site area, whichever is the greater. |
| (d) Peat extraction. | €5 for each hectare of site area. | €15 for each hectare of site area. |
| 6. The use of land for— (a) the winning and working of minerals, (b) the deposit of refuse or waste. | €500, or €50 for each 0.1 hectare of site area, whichever is he greater. | €1500, or €150 for each 0.1 hectare of site area, whichever i the greater. |
| 7. The use of land for— (a) the keeping or placing of any tents, campervans, caravans or other structures (whether or not movable or collapsible) for the purpose of caravanning or camping or the sale of goods, (b) the parking of motor vehicles, (c) the open storage of motor vehicles or other objects or substances. | €80, or €50 for each 0.1 hectare of site area, whichever is the greater. | €240,or €150 for each 0.1 hectare of site area, whichever is the greater. |
| 8. The provision on, in over or under land of plant or machinery, or of tanks or other structures (other tan buildings) for storage purposes. | €200, or €50 for each 0.1 hectare of site area, whichever is the greater. | €600, or €150 for each 0.1 hectare of site area, whichever is the greater. |
| 9. The provision of an advertisement structure or the use of an existng structure or other land for the exhibition of advertisements. | €80, or €20 for each quare metre, or part thereof, of advertising space to be provided, whichever is the greater. | €240, or €60 for each square metre, or part thereof, of advertising space to be provided, whichever is the greater. |
| 10. The provision of overhead tranmission or distribution lines for conducting electricity, or overhead telcommunications lines. | €80, or €50 for each 1,000 metres length, or part thereof, whichever is the greater. | €240, or €150 for each 1,000 metres length, or part thereof, whichever is the greater. |
| 11. The use of land as a golf course or a pitch and putt couse. | €50 for each hectare of site area. | €150 for each hectare of site area. |
| 12. The use of land as a buril ground. | €200, or €50 for each hectare of site area, whichever is the greater. | €600, or €150 for each hectare of site area, whichever is the greater. |
| 13. Development not coming within any of the foregoing classes. | €80, or €10 for each 0.1 hectare of site area, whichever is the greater. | €240, or €30 for each 0.1 hectare of site area, whichever is the greater. |
[1] From correspondence with the Department of the Environment Northern Ireland 04/111/10
[2] A&L Goodbody Planning and Environmental http://www.algoodbody.com/invest-section/planning-and-environmental.aspx (accessed 08/11/10)
[3] imerick County Council Request for further information or clarification http://www.lcc.ie/Planning/Planning_Application_Guide/Stage3/Request_for_further_information.htm (accessed 08/11/10)
[4] A&L Goodbody The Planning and Development (Amendment) Act 2010 (July 2010) http://www.lexology.com/library/detail.aspx?g=8091f9e1-2f50-4c10-812b-7d5dc00ea1fa (accessed 08/11/10)
[5] A&L Goodbody Planning and Environmental http://www.algoodbody.com/invest-section/planning-and-environmental.aspx (accessed 08/11/10)
[6] Planning (Fees) (Amendment)Regulations (Northern Ireland) 2010 http://www.opsi.gov.uk/sr/sr2010/nisr_20100294_en_1 (accessed 04/11/10)
[7] Ibid
[8] Correspondence with Department of the Environment 08/11/10
[9] NI Direct Making an appeal http://www.nidirect.gov.uk/index/information-and-services/property-and-housing/repairs-planning-and-building-regulations/planning-appeals/making-an-appeal.htm (accessed 04/11/10)
[10] Ibid
[11] The Planning Service NI Permitted development rights for microgeneration development http://www.planningni.gov.uk/index/news/news_consultation/news_consultations_pdrights_microgeneration_211009 (accessed 05/11/10)
[12] Ibid
[13] From telephone conversation with Communities and Local Government 04/11/10
[14] Town and Country Planning (Fees for Application and Deemed Applications) (Amendment) (England) Regulations 2008 http://www.legislation.gov.uk/uksi/2008/958/contents/made
[15] Ibid
[16] Ibid
[17] Directgov Making a planning appeal http://www.direct.gov.uk/en/HomeAndCommunity/Planning/PlanningAppeals/DG_10026061 (accessed 05/10/11)
[18] Communities and Local Government (April 2007) Changes to permitted development: consultation paper 1 – permitted development rights for householder microgeneration
[19] Communities and Local Government Small-scale renewables and low-carbon technology Non-domestic permitted development review: Final report (November 2009) http://www.communities.gov.uk/publications/planningandbuilding/smallscalereview?view=Standard
[20] Parliamentary Questions 15394, tabled 09/09/10
[21] The Town and Country Planning (Fees for Applications and Deemed Applications) (Scotland) Amendment Regulations 2010 http://www.legislation.gov.uk/ssi/2010/141/regulation/2/made (accessed 04/11/10)
[22] Ibid
[23] Ibid
[24] Ibid
[25] The Scottish Government Appeals Guide http://www.scotland.gov.uk/Topics/Built-Environment/planning/decisions-appeals/Appeals/AppealsGuide#a12 (accessed 04/11/10)
[26] The Town and Country Planning (General Permitted Development) (Scotland) http://www.legislation.gov.uk/ssi/2010/27/article/2/made
[27] The Town and Country Planning (General Permitted Development) (Domestic Microgeneration) (Scotland) Amendment Order 2009 http://www.legislation.gov.uk/ssi/2009/34/schedule/made
[28] Scottish Government Permitted Development Rights for Microgeneration Equipment on Non-Domestic Properties – Consultation (July 2010) http://scotland.gov.uk/Publications/2010/07/15092031/1
[29] Ibid
[30] Welsh Assembly Government Generating your own energy (July 2010) http://wales.gov.uk/docs/desh/publications/101027currentgyoeen.pdf
[31] Correspondence with Monaghan, Donegal and Cavan Planning Authorities 05/11/10
[32] Welsh Assembly Government Generating your own energy (July 2010) http://wales.gov.uk/docs/desh/publications/101027currentgyoeen.pdf

1 Introduction
The following paper provides background information on connecting renewable generation to the electricity grid with reference to connection procedures in the UK, the Republic of Ireland, Denmark and Germany.
2 The Grid
Figure 1, on the following page, outlines the workings of a modern electricity grid. As is evident from the diagram, renewable energy may fit into the system at two separate points – the transmission system and the distribution system.
The transmission system, or network, transmits electricity from power stations over high-voltage lines. The operations of the transmission network are overseen by the Transmission System Operator (TSO). As such, it is generally large-scale generators who connect to the transmission network.[1] The TSOs in the UK and the Republic of Ireland are as follows:
The distribution network delivers lower voltage electricity from 'grid supply points' to the customer. The distribution network facilitates 'distributed power', where small to medium scale generators (often utilising renewable sources) feed power directly into the distribution network.[3]
Across Great Britain there are a wide variety of Distribution Network Operators (DNOs) in operation. In Northern Ireland and the Republic of Ireland DNO functions are carried out by NIE and ESB Networks respectively. Please see Figure 2 for more details.
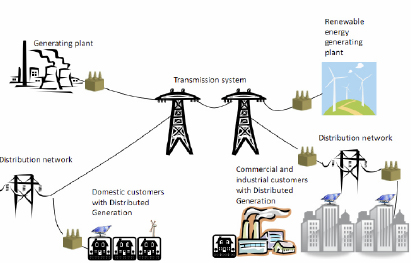
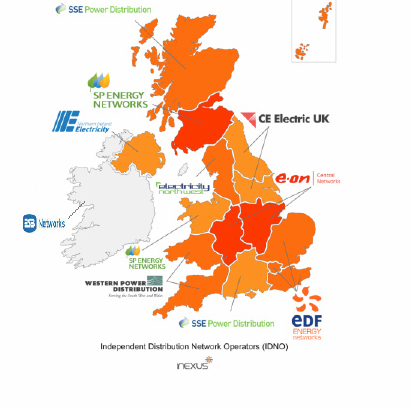
3 Connection Cost
The cost of integrating renewable energy supplied electricity (RES-E) into the grid is comprised of three factors;
Looking at each cost centre in more detail:
Across the EU, jurisdictions tend to operate within one of three variations of grid cost allocation – a Deep cost allocation, Shallow cost allocation or hybrid cost allocation.
A Deep cost allocation places a requirement on the renewable energy producer to cover the cost of grid connection and any necessary reinforcements to the grid.[8]
Examples of regions operating a deep cost allocation method include Italy and Portugal.[9] The major advantage of such an approach is that the renewable generator is often not liable to pay use of system charges for ongoing grid connection. Conversely, the major disadvantages are:
A Shallow cost allocation requires the renewable energy producer to pay for the cost of connection only. In such models it is often the Transmission Systems Operator (TSO) or Distribution System Operator (DSO) who is required to pay any grid reinforcements.[11] The costs of grid reinforcement in a shallow allocation model are often socialised, that is they are passed onto the consumer in their electricity bill.[12]
Examples of regions operating a shallow cost allocation method include Denmark and Germany.[13] The major advantages of such an approach are:
Disadvantages include:
A third option, known as the hybrid model, offers different cost allocation for connecting to the transmission network compared to the distribution network.[15]
Examples of regions operating a hybrid cost allocation method include the UK and the Republic of Ireland[16]. In both regions deep connection charges apply when connecting to the distribution network and a shallow allocation applies when connecting to transmission network. The advantages and disadvantages of a hybrid system are similar to those outlined above depending on whether the generator is connecting to the distribution network (under a deep model) or the transmission network (under a shallow model).[17]
Prior to connecting to the grid the developer is often subject to an administration fee. In Northern Ireland, for example, the project developer is liable to pay for a network connection and capacity study to determine the final cost of connection, the capacity available at point of connection and the details of work required to provide the connection for specific capacity and technology. The cost associated with the connection and capacity study depends on the capacity of the project seeking connection as follows:
NIE note that the cost of the connection and capacity study 'will be deducted from the final connection charge, provided the project is completed within three years from the initial date of application'.[19]
Connection to the grid may require the developer (or TSO/DSO in a region that employs a shallow connection) to pay the cost of a range of equipment types, including:
Civil works may also be required, further driving up the cost of connection. Other factors influencing the final connection charge include:
Average grid connection costs (in this context grid connection cost is taken to mean the cost for grid extensions, staff costs and all related paper work) in the EU represent approximately 5.13% of the total cost of an onshore wind project and 5.43% in the case of offshore wind. In six countries, Italy, Sweden, Denmark, Poland, Portugal and Finland, the costs are considerably lower representing 2.5% of total project cost (or just over 2.5% in the case of Italy). These results are sourced from a European Wind Energy Association study, 'Wind Barriers', published July 2010. The study caveats the above stating:
…the low sample size for Sweden and Finland does not allow definite conclusions to be drawn.[22]
Portugal's inclusion in this list demonstrates that a deep cost allocation method need not necessarily result in a high connection costs.
Figure 3 outlines mean grid access cost, as a percentage of overall wind project costs (onshore and offshore) across the EU-27 (Sweden and Finland are excluded from the Figure due to the sampling issues mentioned above). In the UK grid connection represents between 4% and 6% of total project cost. In the Republic of Ireland it is just below 8%.[23]
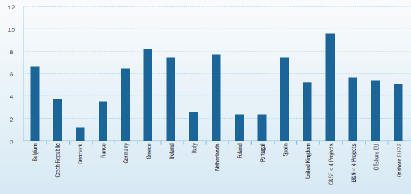
[1] Parliament Office of Science and Technology, Postnote: Electricity in the UK (February 2007) http://www.parliament.uk/documents/post/postpn280.pdf (accessed 09/11/10)
[2] Energy Networks Association Distributed Generation Connection Guide (October 2010) http://2010.energynetworks.org/storage/DGCG_G83_S2_Oct_2010_-_Red.pdf (accessed 09/11/10)
[3] Parliament Office of Science and Technology, Postnote: Electricity in the UK (February 2007) http://www.parliament.uk/documents/post/postpn280.pdf (accessed 09/11/10)
[4] Energy Networks Association Distributed Generation Connection Guide (October 2010) http://2010.energynetworks.org/storage/DGCG_G83_S2_Oct_2010_-_Red.pdf (accessed 09/11/10)
[5] Ibid
[6] GreenNet-EU27 Guiding a least cost grid integration of RES-electricity in an extended Europe (November 2006) http://www.ecn.nl/docs/library/report/2007/b07002.pdf
[7] Busbar refers to an electrical conductor that makes a common connection between several circuits
[8] GreenNet-EU27 Guiding a least cost grid integration of RES-electricity in an extended Europe (November 2006) http://www.ecn.nl/docs/library/report/2007/b07002.pdf
[9] Dalton et al Non-technical barriers to wave energy development, comparing progress in Ireland and Europe (2009) http://www.see.ed.ac.uk/~shs/Wave_Energy/EWTEC_2009/EWTEC_2009_(D)/papers/270.pdf (accessed 15/11/10)
[10] ELEP – European Local Electricity Production Deliverable 2.1, Issue 1 distributed generation connection charging within the European Union - review of current practices, future options and european policy recommendations (September 2005)
[11] GreenNet-EU27 Guiding a least cost grid integration of RES-electricity in an extended Europe (November 2006) http://www.ecn.nl/docs/library/report/2007/b07002.pdf
[12] ELEP – European Local Electricity Production Deliverable 2.1, Issue 1 distributed generation connection charging within the European Union - review of current practices, future options and european policy recommendations (September 2005)
[13] Dalton et al Non-technical barriers to wave energy development, comparing progress in Ireland and Europe (2009) http://www.see.ed.ac.uk/~shs/Wave_Energy/EWTEC_2009/EWTEC_2009_(D)/papers/270.pdf (accessed 15/11/10)
[14] ELEP – European Local Electricity Production Deliverable 2.1, Issue 1 distributed generation connection charging within the European Union - review of current practices, future options and european policy recommendations (September 2005)
[15] GreenNet-EU27 Guiding a least cost grid integration of RES-electricity in an extended Europe (November 2006) http://www.ecn.nl/docs/library/report/2007/b07002.pdf
[16] Dalton et al Non-technical barriers to wave energy development, comparing progress in Ireland and Europe (2009) http://www.see.ed.ac.uk/~shs/Wave_Energy/EWTEC_2009/EWTEC_2009_(D)/papers/270.pdf (accessed 15/11/10)
[17] ELEP – European Local Electricity Production Deliverable 2.1, Issue 1 distributed generation connection charging within the European Union - review of current practices, future options and european policy recommendations (September 2005)
[18] Ibid
[19] Ibid
[20] On wayleaves, NIE states If NIE needs to install equipment on any third party landowner(s) property to facilitate your work then legal consent in the form of a wayleave agreement is required from the relevant landowner(s). Please note that the timescale to obtain landowner approval will depend on the landowner's willingness to sign the wayleave agreement. Work cannot commence on site until these voluntary consents have been obtained.
[21] Northern Ireland Electricity Statement of Charges for connection to the Northern Ireland Distribution system June 2008
[22] EWEA WindBarriers Administrative and grid access barriers to wind power (July 2010) http://www.windbarriers.eu/fileadmin/WB_docs/documents/WindBarriers_report.pdf
[23] Ibid
[24] Ibid

1 Introduction
The following paper is intended to compliment Northern Ireland Assembly Research paper 301 – 'Renewable generation data and policy within selected EU countries' – by examining the national and sub-national governance structures of Denmark, Finland and Germany, and their relationship to renewable energy.
Key findings of the paper:
2 Denmark
Denmark is a constitutional monarchy that operates a unitary system of government within which power is held centrally. Despite the formally centralised structure, local government plays a significant role. As noted in the OECD's latest Country Note (2009):
Central government collects over 70% of [Denmark's] revenues but represents about 33% of all expenditures, suggesting that most goods and service are provided by local governments. Much of the taxes collected at the central level are transferred to local governments, which still have relatively large powers to raise their own powers via taxes. Local governments represent a much larger share of expenditures in Denmark than average in the OECD, indicating that Denmark is a very decentralised country. (Emphasis added).[1]
Danish executive power is exercised by a cabinet, responsible to the Folketing, the region's national parliament. The executive branch of government is comprised of the Prime Minister's Office and 20 other ministries, with energy matters falling under the Ministry of Climate and Energy.[2] The Ministry of Climate and Energy also shares a Minister with the Ministry of Gender Equality.
In 2007, the 14 Counties that made up Danish local government were reorganised into five regions. These regions are further subdivided into 98 municipalities (270 under pre-2007 organisation). The principle remit of local government is the delivery of hospital and health services.[3]
In addition to the above, Copenhagen is governed by a city council.
The Ministry of Climate Change and Energy stated 'vision' is to 'establish a society with a stable and efficient energy supply, capable of dealing with the effects of climate change'. The following areas of responsibility fall within its remit:
Figure 1 (below) outlines the organisational structure of the Ministry (note: the Minister for Climate Change and Energy is also the Minister for Gender Equality, hence the latter's inclusion in the figure). It is evident that, in carrying out its functions, the Ministry has both a domestic and international outlook.
Figure 2 (below) outlines the institutions the Ministry oversees. Looking at each institution in turn:
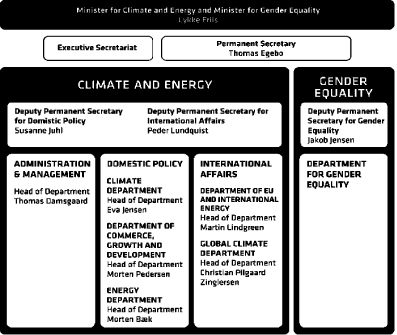
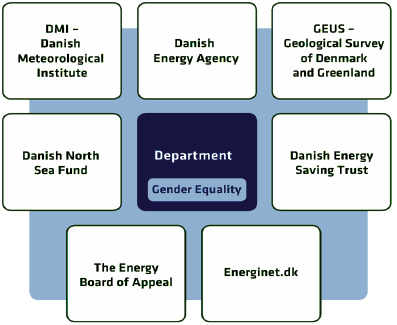
Details of renewable energy development at Denmark's regional government level are as follows:
North Denmark Region wants to be at the forefront in renewable energy and in preparing for climate changes and by this means achieve the national targets of 30% of energy requirements being met by renewable energy sources and a 30% reduction in CO2 emissions as soon as possible. In the near future, renewable energy and CO2 reduction will be highly significant competition parameters. The region will support collaboration in this field with participation of local authorities, research environments, businesses and other interest organisations.[7]
3 Finland
Finland is a republican parliamentary democracy that operates under a unitary system of Government.
Local government's role is also significant, as noted in the most recent OECD report:
Central government collects roughly of total revenues but accounts of less than one third of expenditures, indicating that local governments play a large role in public service delivery. A large portion of the taxes collected by the central government are transferred to local governments and social security funds.[10]
The Finnish constitution places executive power in the President and the Government. The Government is comprised of the Prime Minister and no more than 18 other Ministries, and is scrutinised by a 200 member parliament.
Currently, Finland's central government consists of the Prime Minister's Office and 11 other Ministries. Energy matters fall under the Ministry of Employment and the Economy. The Ministry's specific remit on such matters is 'energy policy and integration of the national preparation and implementation of climate policy'.[11]
Local government in Finland consist of 12 provinces, subdivided into municipalities (415 in total). The provincial level of government is an intermediate stage between local and national government and contains no elected offices. Compared to other countries, the provincial government is less extensive as many of the tasks typical of provincial government elsewhere are carried out at municipal level in Finland.[12] Municipal government in Finland exhibits the following features:
Figure 3 illustrates the Ministry of Employment and Economic Affairs' organisational structure and outlines the various agencies that fall within its remit. An Energy Department, with responsibility for energy matters, makes up a sub-division of the wider Ministry. The Department specifically oversees:
Of the agencies listed in the figure, the following have responsibility for energy:
The Ministry for the Environment has also a role to play in energy matters, specifically, providing a 'viable, energy-efficient built environment that serves as a foundation for improving human wellbeing'.[20]
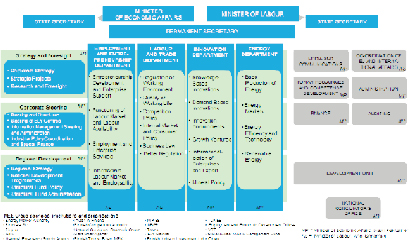
Amongst other areas municipal governments in Finland are responsible for energy supply and environmental protection. The Association of Finnish Local and Regional Authorities adopted an action programme for sustainable development. The action programme set out the key principles which should inform sustainable development strategies at municipal level.[21] These were:
4 Germany
The German state has a federal structure. Under the 'Basic law' areas of authority are shared between the country's 16 component states (the Länder) and the federal government (the Budesregierung).[24] On government revenue collection and spending the OECD have commented:
The federal government plays a small overall role in raising revenues and expenditures compared to the average OECD country. Not including social security funds, the bulk of spending on programmes and policies occurs in the Länder and municipalities. In addition, the sub-federal levels of government have much greater power to tax than other OECD countries, suggesting higher levels of decentralisation.[25]
The federal government consists of the Federal Chancellors office and fourteen other ministries, responsible to the chambers of parliament (the Bundestag and the Bundesrat). Responsibility for energy issues at central level falls across a number of Ministries (see below).
The Bundesrat, the second chamber of the German parliament, is not directly elected – its 69 members are delegates from the Länder. In this sense the Länder governments directly influence Federal policy.
At central government level the lead Ministry for sustainable development is the Federal Chancellery. The country's key priorities under the broad sustainable development policy category are:
Specific responsibility German energy policy is spread across a number of ministries dependent upon the specific initiative involved. This is exemplified by Table 1 (below), which outlines initiatives introduced by the Integrated Energy and Climate Programme (2007) alongside the ministries tasked with taking them forward. Taking the "Energy research and innovation" as an example, responsibility for implementing this initiative is divided amongst five ministries as follows:
Key to this arrangement is the concept of 'horizontal integration', which refers to cross-sectoral or cross-ministerial mechanisms that enable the integration of policy.[28] Within the area of energy this achieved through the State Secretaries' Committee on Sustainable Development, which specifically mandated to deal with sustainability policy (as defined by the key priorities outlined above). Relevant ministries sit on and report to the Committee (see Figure 4 at the end of this document for further details).[29]
Of the ministries with responsibility for the delivery of the Integrated Energy and Climate Strategy (as listed in Table 1), three, in particular, are involved in the majority of initiatives – the Ministry of Economics and Technology (responsible for 17 out of 32 initiatives), the Ministry of the Environment, Nature Conservation and Nuclear Safety (responsible for 19 out of 32 initiatives), and the Ministry for Transport, Building and Urban Affairs (responsible for 17 out of 32 initiatives). It is worthwhile examining each of these ministries in more detail.
The German Ministry of Economics and Technology is internally split into seven sub-divisions, or directorates, of which energy is one. The directorate plays a central role in energy policy development, based upon the themes of 'economic efficiency, security of supply and environmental compatibility'.[30] Key policy areas include:
Consideration of energy issues, particularly the development of renewable resources, also informs the remit of the ministry's directorate of industrial policy. The directorate has, amongst other tasks, responsibility for environment and resources, emissions control, energy taxation and environmental innovation.[31]
The Ministry of Economics and Technology with the Ministry of Transport, Building and Urban Affairs cooperates on the Federal Government Joint Unit for Electricity Mobility
With regard to external agencies associated with the ministry:
Climate Protection, Environment and Energy, Renewable Energies, International Cooperation is one of six internal directorates within the Ministry for the Environment, Nature Conservation and Nuclear Safety.[36] The directorate has responsibility for:
With regard to external agencies the ministry oversees the work of the
The Federal Ministry of Transport, Building and Urban Affairs energy responsibilities fall under the internal subdivision 'Environmental Policy and Infrastructure'. Notably, energy is one of a number of further subdivisions of this directorate. The Ministry is responsible for energy matters that impact transport policy, building and housing policy, and integrated transport policy, including:
The Ministry of Transport, Building and Urban Affairs cooperates with the Ministry of Economics and Technology on the Federal Government Joint Unit for Electricity Mobility.
| Initiative | Ministerial Responsibility |
| Combined heat-and-power generation | Ministry of Economics and Technology |
| Expansion of renewable energies in the power sector | Ministry for the Environment, Nature Conservation and Nuclear Safety |
| Ministry of Transport, Building and Urban Affairs | |
| Ministry of Economics and Technology | |
| CCS technologies | Ministry of Economics and Technology |
| Ministry for the Environment, Nature Conservation and Nuclear Safety | |
| Ministry of Transport, Building and Urban Affairs | |
| Ministry of Education and Research | |
| Smart metering | Ministry of Economics and Technology |
| Clean power-station technologies | Ministry for the Environment, Nature Conservation and Nuclear Safety |
| Introduction of modern energy management systems | Ministry of Finance |
| Support programmes for climate protection and energy efficiency (apart from buildings) | Ministry for the Environment, Nature Conservation and Nuclear Safety |
| Ministry of Economics and Technology | |
| Ministry of Transport, Building and Urban Affairs | |
| Ministry of Food, Agriculture and Consumer Protection | |
| Energy-efficient products | Ministry for the Environment, Nature Conservation and Nuclear Safety |
| Ministry of Economics and Technology | |
| Provisions on the feed-in of biogas to natural gas grids | Ministry for the Environment, Nature Conservation and Nuclear Safety |
| Ministry of Economics and Technology | |
| Energy Saving Ordinance | Ministry of Transport, Building and Urban Affairs |
| Ministry of Economics and Technology | |
| Ministry for the Environment, Nature Conservation and Nuclear Safety | |
| Operating costs of rental accommodation | Ministry of Transport, Building and Urban Affairs |
| Ministry of Economics and Technology | |
| Ministry for the Environment, Nature Conservation and Nuclear Safety | |
| Modernisation programme to reduce CO2 emissions from buildings | Ministry of Transport, Building and Urban Affairs |
| Ministry of Finance | |
| Ministry of Education and Research | |
| Ministry of Economics and Technology | |
| Ministry for the Environment, Nature Conservation and Nuclear Safety |
| Initiative | Ministerial Responsibility |
| Energy-efficient modernisation of social infrastructure | Ministry of Transport, Building and Urban Affairs |
| Renewable Energies Heat Act | Ministry for the Environment, Nature Conservation and Nuclear Safety |
| Ministry of Transport, Building and Urban Affairs | |
| Ministry of Economics and Technology | |
| Programme for the energy-efficient modernisation of federal buildings | Ministry of Transport, Building and Urban Affairs |
| Ministry for the Environment, Nature Conservation and Nuclear Safety | |
| CO2 strategy for passenger cars | Ministry for the Environment, Nature Conservation and Nuclear Safety |
| Ministry of Transport, Building and Urban Affairs | |
| Ministry of Finance | |
| Expansion of the biofuels market | Ministry of Finance |
| Ministry for the Environment, Nature Conservation and Nuclear Safety | |
| Ministry of Education and Research | |
| Reform of vehicle tax on CO2 basis | Ministry of Finance |
| Energy labelling of passenger cars | Ministry of Economics and Technology |
| Reinforcing the influence of the HGV toll | Ministry of Transport, Building and Urban Affairs |
| Aviation - emissions trading air traffic | Ministry for the Environment, Nature Conservation and Nuclear Safety |
| Aviation - Single European Sky | Ministry of Transport, Building and Urban Affairs |
| Aviation - emissions trading landing charges | Ministry of Transport, Building and Urban Affairs |
| Shipping - emission trading | Ministry for the Environment, Nature Conservation and Nuclear Safety |
| Ministry of Transport, Building and Urban Affairs | |
| Shipping - limit values | Ministry of Transport, Building and Urban Affairs |
| Reduction of emissions of fluorinated greenhouse gases | Ministry for the Environment, Nature Conservation and Nuclear Safety |
| Procurement of energy-efficient products and services | Ministry of Economics and Technology |
| Energy research and innovation | Ministry of Economics and Technology |
| Ministry for the Environment, Nature Conservation and Nuclear Safety | |
| Ministry of Education and Research | |
| Ministry of Transport, Building and Urban Affairs | |
| Ministry of Food, Agriculture and Consumer Protection | |
| Electric mobility | Ministry of Economics and Technology |
| Ministry of Transport, Building and Urban Affairs | |
| Ministry of Education and Research | |
| Ministry for the Environment, Nature Conservation and Nuclear Safety | |
| International projects on climate protection and energy efficiency | Ministry for the Environment, Nature Conservation and Nuclear Safety |
| Ministry of Economics and Technology | |
| Reporting on energy and climate policy by German embassies and consulates | Federal Foreign Office |
| Transatlantic climate and technology initiative | Federal Foreign Office |
| Ministry of Economics and Technology |
The constitution of Germany allocates certain legislative powers to the Länder – for example, education, culture, media and natural resources. The majority of legislative responsibilities are concurrent competencies, meaning the Länder can only legislate when the federal government has not already done so.
In practice legislation is generally made at federal level, with the Länder responsible for its implementation.[43] However, when it comes to central climate policy in general, the Länder have few implementation responsibilities. The Länder can, however, establish measures themselves, so long as these are additional.[44]
The Länder are represented at Federal level in the "Bundesrat", the second chamber of the German parliament, which has a power of veto against federal government initiatives.[45]
Significantly, the "Länder" act as research funding bodies – contributing €269m in funding (across all areas) during 2007.[46]
In addition, policy making in Germany is characterised by consultation and consensus.[47] For example, the country's sustainable development strategy, although devised by the federal government, involved input from the Länder during the formulation process. The Länder have also been involved in contributing to strategic progress reports. Figure 4 (below) provides an overview of this policy development process. The figure demonstrates the role of the Federal Committee of State Secretaries for Sustainable Development, as well as the input of the Länder and other stakeholders in the process.[48]
Support for climate change policy in general and renewable energy policy in particular, differs from Länder to Länder. It is often the case that specific Länder supports policy that fit with their specific interests and capabilities. This is evident with renewable energy, those Länder with established renewable industries - Schleswig-Holstein (wind power), Lower Saxony (windpower and biogas), Bavaria (hydro power and photovoltaic), Brandenburg (biomass), and North Rhine-Westphalia (waste and landfill gas) – have been stronger in demanding regulations for renewables (particularly for subsidies).[49]
At Länder level, all state governments have their own Ministry or subdivision of a ministry responsible for energy issues. State-wide energy or environment agencies are also common. For example, a sub-division of the Brandenburg Ministry of Environment, Health and Consumer Protection has responsibility for energy[50], with the arms-length body, the Brandenburg Economic Development Board, also working on energy issues.[51] Similarly, the state of Baden-Württemberg's Ministry of the Environment, Nature Conservation and Transport and its associated body, the Climate Protection and Energy Agency, has responsibility for energy matters.[52]
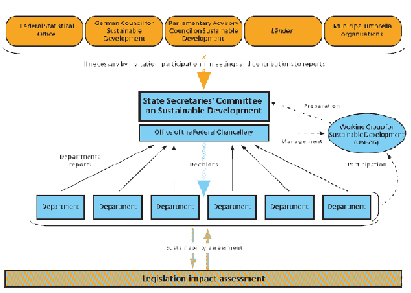
[1] OECD Government at a glance 2009 – Country Note: Denmark (2009) http://www.oecd.org/dataoecd/5/50/44124973.pdf
[2] Statsministeriet The Ministries http://www.stm.dk/_a_2820.html (accessed 23/11/10)
[3] Banks, A.S, et al – Political Handbook of the World 2010 Washington DC: Congressional Quarterly, 2010
[4] The Energy Saving Trust, About the Danish Energy Saving Trust http://www.savingtrust.dk/about-us/about-the-trust (accessed 24/11/10)
[5] Region Hovedstaden, Regional Development Plan (2008) http://www.regionh.dk/NR/rdonlyres/D07BBC02-EE45-4FDC-AEF7-0BFCA1ECA99C/0/080904_RUP_UK_net.pdf ( accessed 29/11/10)
[6] Region Midtjylland, The Leading Energy and Environment Region (2009) http://www.rm.dk/regional+udvikling/v%c3%a6kstforum/indsatsomr%c3%a5der/energi+og+milj%c3%b8/english+version ( accessed 29/11/10)
[7] Region Nordjylland Regional Development Plan (2007) http://www.rn.dk/NR/rdonlyres/46389D16-8094-4195-8C4E-1FB826318AA4/0/NorthDenmarkRegion_RegionalDevelopmentPlan2007.pdf (accessed 29/11/2010)
[8] Region Sjælland (Region Zealand), Regional Climate Strategy http://www.regionsjaelland.dk/Sider/climateregion.aspx (accessed 29/11/10)
[9] Region Syddanmark Sustainable Development Strategy (2008) http://www.regionsyddanmark.dk/wm235866 (accessed 29/11/10)
[10] OECD Government at a glance 2009 – Country Note: Finland (2009) http://www.oecd.org/dataoecd/35/39/43925746.pdf
[11] Ministry of Employment and Economy Finland, Energy http://www.tem.fi/index.phtml?l=en&s=2070 (access 25/11/10)
[12] US Library of Congress, Finland – Provincial Government http://countrystudies.us/finland/119.htm (accessed 25/11/10)
[13] Local Finland, Local self-government http://www.kunnat.net/k_perussivu.asp?path=1;161;279;280;37558 (accessed 25/11/10)
[14] Ministry of Employment and Economy Finland, Energy http://www.tem.fi/index.phtml?l=en&s=2070 (access 25/11/10)
[15] The Energy Market Authority http://www.energiamarkkinavirasto.fi/select.asp?gid=102 (accessed 25/11/10)
[16] Geological Survey of Finland http://en.gtk.fi/ (accessed 25/11/10)
[17] MIKES Finland http://www.mikes.fi/ (accessed 25/11/10)
[18] TEKES http://www.tekes.fi/en/community/Home/351/Home/473/ (25/11/10)
[19] VTT http://www.vtt.fi/?lang=en (accessed 25/11/10)
[20] The Ministry for the Environment http://www.ymparisto.fi/default.asp?node=21051&lan=en
[21] European Industrial Relations Observatory, Finland – Greening the European economy: responses and initiatives by Member States and social partners http://www.eurofound.europa.eu/eiro/studies/tn0908019s/fi0908019q.htm (accessed 29/11/10)
[22] Ibid
[23] The Association of Finnish Local and Regional Authorities, How Finnish local authorities can slow down and adapt to climate change – Policy guidelines by the Association of Finnish Local and Regional Authorities (2008) http://www.kunnat.net/k_perussivu.asp?path=1;161;279;280;37564 (accessed 29/11/10)
[24] Banks, A.S, et al – Political Handbook of the World 2010 Washington DC: Congressional Quarterly, 2010
[25] OECD Government at a glance 2009 – Country Note: Germany (2009)
[26] The Federal Government, Sustainability – priority fields of action http://www.bundesregierung.de/nn_208962/Content/EN/StatischeSeiten/Schwerpunkte/Nachhaltigkeit/nachhaltigkeit-2007-04-13-prioritaere-handlungsfelder.html
[27] Federal Ministry for the Environment, Nature Conservation and Nuclear Safety, Integrated Energy and Climate Programme (2007) http://www.bmu.de/files/pdfs/allgemein/application/pdf/klimapaket_aug2007_en.pdf (accessed 30/11/10)
[28] Beck, S, et al. Climate policy integration, coherence and governance in Germany http://ccsl.iccip.net/peer2_germancase9792.pdf (accessed 29/11/10)
[29] European Sustainable Development Network, Country profile – Germany http://www.sd-network.eu/?k=country_profiles&s=single_country_profile&country=Germany
[30] Federal Ministry of Economics and Technology, Energy Policy http://www.bmwi.de/English/Navigation/energy-policy.html (accessed 29/11/10)
[31] Ibid
[32] The German Energy Agency http://www.dena.de/en/infos/about-dena/ (accessed 29/11/10)
[33] The Federal Network Agency http://www.bundesnetzagentur.de/EN/Home/home_node.html (accessed 23/11/10)
[34] The Federal Office of Economics and Export Control http://www.bafa.de/bafa/en/index.html (accessed 29/11/10)
[35] The Federal Ministry of Economics and Technology, Agencies, http://www.bmwi.de/English/Navigation/Ministry/agencies,did=161280.html (accessed 29/11/10)
[36] The Federal Ministry for the Environment, Nature Conservation and Nuclear Safety, Organisational Chart - Minister and State Secretaries http://www.bmu.de/english/the_ministry/tasks_organisation_financing/organisational_chart/doc/35037.php (accessed 30/11/10)
[37] The Federal Ministry for the Environment, Nature Conservation and Nuclear Safety, General Information - Climate Protection http://www.bmu.de/english/climate/general_information/doc/4311.php (accessed 30/11/10)
[38] The Federal Ministry for the Environment, Nature Conservation and Nuclear Safety, Climate and Energy http://www.bmu.de/english/climate_energy/doc/41327.php (accessed 30/11/10)
[39] The Federal Ministry for the Environment, Nature Conservation and Nuclear Safety, The Federal Environmental Agency http://www.bmu.de/english/the_ministry/subordinate_authorities/federal_environmental_agency/doc/3097.php
[40] The Federal Ministry for the Environment, Nature Conservation and Nuclear Safety, The Federal for Nature Conservation http://www.bmu.de/english/the_ministry/subordinate_authorities/federal_agency_for_nature_conservation/doc/3099.php (accessed 30/11/10)
[41] The Federal Ministry for the Environment, Nature Conservation and Nuclear Safety, The Federal for Radiation Protection http://www.bmu.de/english/the_ministry/subordinate_authorities/federal_office_for_radiation_protection/doc/3102.php (accessed 30/11/10)
[42] The Federal Ministry of Transport, Building and Urban Affairs Overview http://www.bmvbs.de/EN/Home/home_node.html (accessed 30/11/10)
[43] Happarets , S. Comparing subnational governance systems for sustainable development: degrees of autonomy and challenges to vertical policy integration, Institute for International and European Policy , Katholieke Universiteit Leuven (2009)
[44] Weidner H, German Climate Change Policy : A Success Story With Some Flaws (2008) The Journal of Environment Development 17: 356
[45] Ibid
[46] Research in Germany, the Länder http://www.research-in-germany.de/research-landscape/rpo/41822/l-nder-institutions.html (accessed 29/11/10)
[47] Beck, S, et al. Climate policy integration, coherence and governance in Germany http://ccsl.iccip.net/peer2_germancase9792.pdf (accessed 29/11/10)
[48] Budenskanzlermt, Germany: State Secretaries´ Committee for Sustainable Development –"New Drive for Sustainable Development Strategies – The Power of Smart Linkages" (2009) http://www.sd-network.eu/pdf/doc_workshops/2009_brussels/Bauernfeind.pdf
[49] Weidner H, German Climate Change Policy : A Success Story With Some Flaws (2008) The Journal of Environment Development 17: 356
[50] Brandenburg Ministry of Environment, Health and Consumer Protection, Organisation Chart http://www.mugv.brandenburg.de/cms/media.php/lbm1.a.2315.de/mugv_en.pdf (accessed 30/11/10)
[51] Brandenburg Economic Development Board http://www.zab-brandenburg.de/en/28.aspx (accessed 30/11/10)
[52] Baden-Württemberg's Ministry of the Environment, Nature Conservation and Transport http://www.uvm.baden-wuerttemberg.de/servlet/is/1539/Flyer_Ministry_of_the_Environment_BW.pdf?command=downloadContent&filename=Flyer_Ministry_of_the_Environment_BW.pdf (accessed 30/11/10)
[53] Budenskanzlermt, Germany: State Secretaries´ Committee for Sustainable Development –"New Drive for Sustainable Development Strategies – The Power of Smart Linkages" (2009) http://www.sd-network.eu/pdf/doc_workshops/2009_brussels/Bauernfeind.pdf