
Research and Library Services
Research Paper
21/11/07
Comparative analysis of draft budget 2008-11
Jodie Carson
Research Officer
Research Papers are compiled for the benefit of Members of The Assembly and their personal staff. Authors are available to discuss the contents of these papers with Members and their staff but cannot advise members of the general public.
CONTENTS
- Introduction
- Context
- The Impact of the Comprehensive Spending Review 2007
- The Northern Ireland Departmental Expenditure Limits 2005-11
4.1 Departmental Allocations: Current Expenditure
4.2 Departmental Allocations: Capital Expenditure
- Department of Finance and Personnel (DFP) Allocations
5.1 Departmental Priorities
5.2 Current Expenditure
5.3 Capital Expenditure
5.4 Efficiency Targets
- Other Trends
6.1 Spending Priorities
6.2 Underspend
6.3 Over-commitment
Annex 1 Reconciliation of planned current expenditure to HM treasury resource control totals
Annex 2 Draft Budget 2008-11: current expenditure allocations
Annex 3 Draft Budget 2008-11: Capital Investment allocations
Annex 4 Department of Finance and Personnel: current and investment expenditure
1. Introduction
This paper highlights a number of comparisons between the recently announced ‘Draft Budget 2008-11’ and the previous ‘Priorities and Budget 2006-08’. It begins by considering the impact of the Comprehensive Spending Review 2007 upon the level of resources available to Northern Ireland. The current and capital allocations are then considered, by department, in Section 4. Section 5 details the specific implications of Draft Budget 2008-11 for the Department of Finance and Personnel. Finally, Section 6 considers trends in the Executive’s priorities and levels of underspend and planned over-commitment.
2. Context
The Minister for Finance and Personnel, Peter Robinson, presented the Draft Budget 2008-11 on 25 October 2007. The Minister identified economic growth as the main theme;
“The Executive is committed to delivering the economic vision of an innovative, entrepreneurial, wealth-generating, export-oriented economy. To achieve this we need to ensure that policies are in place which will encourage private sector growth and expansion. For too long the local private sector has been constrained by the influence of the Northern Ireland public sector. Now is an opportune time to change the focus of economic policy.” 1
This focus is consistent with the priorities identified in the Executive’s Draft Programme for Government (PfG), namely:
- Grow a dynamic innovative economy
- Promote tolerance, inclusion, health and well being
- Invest to build our infrastructure
- Deliver modern, high quality and efficient Public Services
- Protect and enhance our Environment and natural resources
3. The Impact of the Comprehensive Spending Review 2007
The resources available to the Executive for allocation depend primarily upon changes in comparable spending programmes in England. On 9 th October 2007, the outcome of the Comprehensive Spending Review was announced, confirming that the resources available for Northern Ireland would be less than in recent years. The resultant Departmental Expenditure Limits (DEL) for Northern Ireland from 2007-08 to 2010-11 are as follows:
Table 2.1 Northern Ireland Departmental Expenditure Limits ( DEL) 2007-08 to 2010-11
(£millions)
2007-08
2008-09
2009-10
2010-11
Departmental Expenditure Limit ( DEL)
8,036.9
8,275.1
8,553.7
8,927.2
Percentage Increase on previous year
+3%
+3.4%
+4.4%
Source: Draft Budget 2008-11
In relation to previous annual increases, the 3% increment in Northern Ireland’s DEL between 2007-08 and 2008-09 is relatively low. Priorities and Budget (P&B) 2006-08 set out plans for 4.8% annual increases in current expenditure between 2005-07 and 2006-08.
To reflect the true resource DEL, Annex 1 shows the reconciliation of planned current expenditure to HM Treasury Resource Control Totals.
4. The Northern Ireland Departmental Expenditure Limits 2005-11
Departmental budgets are separated into current and capital budgets:
- Current budgets , or resource budgets, include most direct expenditure on public sector pay and providing services, e.g. health or education reflecting continuing programmes;
- Capital budgets include expenditure on new construction, land, extensions / alterations of existing buildings, and the purchase of fixed assets such as plant and machinery. It also includes expenditure on stocks and grants / lending for capital purposes.
4.1 Departmental Allocations: Current Expenditure
Annex 2 shows the departmental allocations for current expenditure, as outlined in Draft Budget 2008-11. To enable a comparative analysis, table 4.1 overleaf shows these projections alongside those for 2005-06 and 2006-07 presented in Priorities and Budget 2006-08. The key trends which emerge are as follows:
- The nominal increase in total DEL from 2006-07 to 2007-08 is 2.7% versus a budgeted increase of 4.8% between 2005-06 and 2006-07;
- In terms of the planned current expenditure allocations for 2007-08, the biggest ‘losers’ are the Departments of Regional Development and Finance and Personnel, with reductions of 27.3% and 17.1% respectively;
- The Departments of Employment and Learning and Education have both been awarded an additional 6.4% on the previous year’s DEL allocations. The Department of Health has been allocated an additional 5.9%.
- Subsequent changes to departmental shares are less significant, as below:
Figure 4.1 Departmental Allocations of DEL (Nominal)
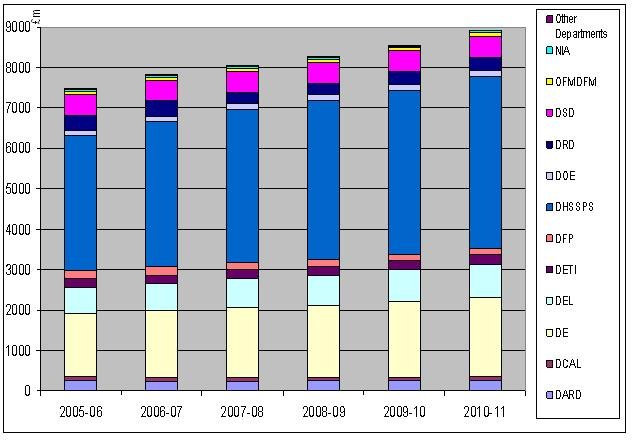
Table 4.1 Draft Departmental Expenditure Limits 2005-11 2
2005-06
2006-07
% Change
2007-08
% Change
2008-09
% Change
2009-10
% Change
2010-11
% Change
DARD
255.7
233.3
-8.8
226.4
-3.0
235.7
4.1
237.8
0.9
244.7
2.9
DCAL
99.5
102.7
3.2
108.3
5.5
107.3
-0.9
109.4
2.0
117.5
7.4
DE
1566.8
1632.8
4.2
1719.2
5.3
1770.5
3.0
1870.5
5.6
1952.3
4.4
DEL
646.4
687.4
6.3
731.5
6.4
734.4
0.4
771.2
5.0
818.8
6.2
DETI
199.9
199.8
-0.1
199.6
-0.1
214.2
7.3
223.9
4.5
229.8
2.6
DFP
205.9
211.7
2.8
175.4
-17.1
179.5
2.3
162.4
-9.5
160.5
-1.2
DHSSPS
3340.3
3591.9
7.5
3804.8
5.9
3938.8
3.5
4064.1
3.2
4259.2
4.8
DOE
133.3
126.6
-5.0
134.7
6.4
137.2
1.9
136.2
-0.7
135.1
-0.8
DRD
375.5
382.3
1.8
278.0
-27.3
287.6
3.5
309.2
7.5
335.2
8.4
DSD
510.2
516.8
1.3
521.0
0.8
529.5
1.6
522.6
-1.3
522.3
-0.1
OFMDFM
70.8
74.8
5.6
70.9
-5.2
73.9
4.2
79.4
7.4
84.3
6.2
NIA
47.6
47.6
0.0
47.6
0.0
47.6
0.0
47.6
0.0
47.6
0.0
Other Departments
17.4
19
9.2
19.6
3.2
18.9
-3.6
19.4
2.6
19.8
2.1
Total DEL
7469.3
7826.7
4.8
8036.9
2.7
8275.1
3.0
8553.7
3.4
8927.2
4.4
4.2 Departmental Allocations: Capital Expenditure
Annex 3 presents the draft departmental allocations for capital expenditure. Table 4.2 compares these with those outlined in Priorities and Budget 2006-08:
- It should be noted that the values presented in Draft Budget 2008-11 are expressed “net of receipts”. This explains the negative trend emerging in 2008-09 in respect of DFP, and in 2010-11 in respect of DARD :
Figure 4.2 Departmental Allocations of Capital Investment (Nominal)
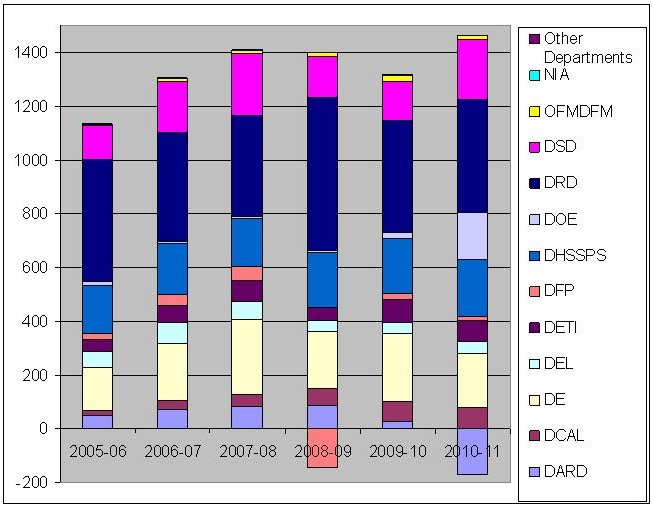
Table 4.2 Draft Capital Investment Allocations (Net of Receipts) 2005-11 3
2005-06
2006-07
% change
2007-08
% change
2008-09
% change
2009-10
% change
2010-11
% change
Capital Inv
Capital Inv
Capital Inv
Capital Inv
Capital Inv
Capital Inv
DARD
49.4
73.3
48.4
83.0
13.2
83.6
0.7
28.6
-65.8
-171.1
-698.3
DCAL
17.8
31.8
78.7
43.0
35.2
64.5
50.0
74.1
14.9
79.9
7.8
DE
162.3
213.5
31.5
279.8
31.1
213.6
-23.7
252.3
18.1
200.1
-20.7
DEL
60.2
75.5
25.4
68.9
-8.7
40.7
-40.9
38.7
-4.9
44.6
15.2
DETI
43.4
62.1
43.1
77.5
24.8
48.0
-38.1
87.9
83.1
78.2
-11.0
DFP
22.6
42.2
86.7
51.1
21.1
-145.0
-383.8
22.7
-115.7
16.0
-29.5
DHSSPS
176.3
188.2
6.7
177.8
-5.5
202.6
13.9
203.7
0.5
213.2
4.7
DOE
14.1
11.0
-22.0
9.8
-10.9
10.7
9.2
22.5
110.3
171.2
660.9
DRD
455.6
403.3
-11.5
373.1
-7.5
568.7
52.4
416.0
-26.9
419.9
0.9
DSD
125.8
192.4
52.9
231.3
20.2
153.7
-33.5
145.3
-5.5
223.4
53.8
OFMDFM
3.2
8.8
175.0
11.7
33.0
12.4
6.0
23.2
87.1
17.3
-25.4
NIA
2.0
2.0
0.0
2.0
0.0
0.3
-85.0
0.3
0.0
0.3
0.0
Other Departments
0.2
0.4
100.0
0.4
0.0
0.4
0.0
0.4
0.0
0.4
0.0
Total Allocations
1132.9
1304.5
15.1
1409.4
8.0
1254.2
-11.0
1315.7
4.9
1293.4
-1.7
Source: Draft Budget 2008-11 and Priorities and Budget 2006-08
5. Department of Finance and Personnel (DFP) Allocations
In Priorities and Budget 2006-08 (P&B 2006-08), the key objectives of DFP were as follows:
- To prioritise the use of resources available to NI, ensure that these are used efficiently and secure the reform and modernisation of public services.
- To deliver efficient and cost effective services to the public in the Department’s area of executive responsibility.
Draft Budget 2008-11 highlights, for DFP, the importance of:
- Leading Reform;
- Delivering Value; and
- Promoting Sustainability
The key focus for 2008-11 will be the delivery of Civil Service Reform within DFP and the Northern Ireland Civil Service (NICS). DFP will also lead on simplifying and improving citizen access to public services in Northern Ireland, including the introduction of a single telephone number point of contact for selected services by the end of 2008.
Draft Budget 2008-11 prescribes a significant reduction in the share of DEL allocated to DFP. With the exception of the Department for Regional Development, (DRD), DFP has suffered the largest cut; the current year allocation is 17.1% lower than that allocated for 2006-07, and this trend will continue in subsequent years:
Figure 5.1 Share of Current Expenditure Allocated to DFP
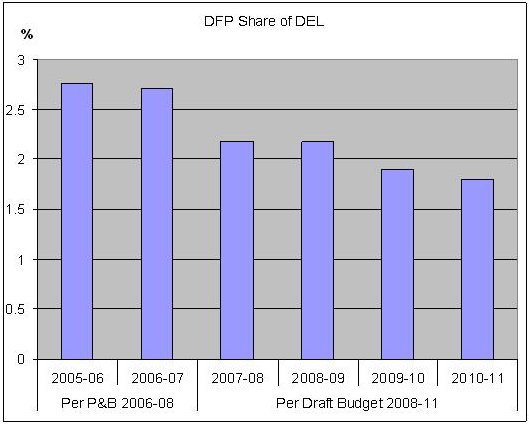
Source: Derived from Draft Budget 2008-11 & Priorities and Budget 2006-08
The Department’s proposed capital allocation is intended, as part of the Civil Service Reform, to enable the replacement and modernisation of business processes across the NICS. It should also enable the capital accommodations programmes associated with the NICS estate, and the enhancement / maintenance of the Department’s ICT systems. Additionally, capital expenditure will be incurred to improve both the energy performance of, and the level of carbon omissions from, buildings occupied by public bodies.
Figure 5.2 Share of Capital Investment Allocated to DFP
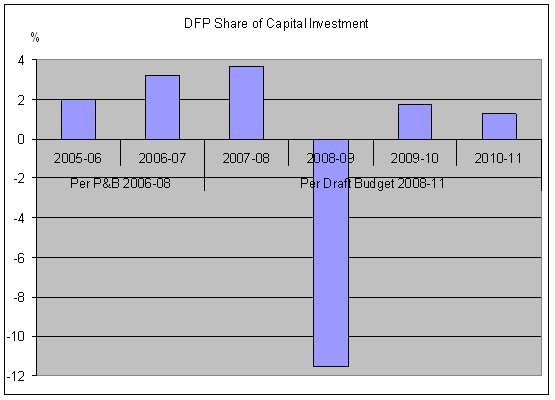
Source: Derived from Draft Budget 2008-11 & Priorities and Budget 2006-08
The negative investment value for 2008-09 is due to the projected £162m cash injection in respect of NICS accommodation services.
The graphs above have shown the relative decline in the resources available to DFP, however, it is intended that this be supplemented by the achievement of efficiencies. The Department has a target to deliver cash releasing efficiencies of £5.7 million, £10.3 million and £14.8 million respectively, over the period 2008-09 to 2010-11.
It is anticipated that savings will accrue from the ongoing review of administrative expenditure and staff budgets, and by improving organisational structure. Additionally, by improving productivity and rationalising NICS office accommodation, DFP should realise additional spending power.
Annex 4 details the specific current and capital expenditure plans for the Department of Finance and Personnel.
6. Other Trends
Draft Budget 2008-11 has shown the economy to be the key focus; this has become increasingly prioritised over recent years. The figure below reflects the Executive’s changing priorities, per the Budget and Programme for Government, and Priorities and Budget documents 4.
Figure 6.1 Trends in Executive’s Priorities 2003-08
2003-06
2004-06
2005-08
2006-08
- Grow as community
- Work for a Healthier People
- Invest in Skills and Education
- Secure a Competitive Economy; and
- Develop North/South, East/West relations
- As in 2003-06, with renewed focus upon:
- Tackling sectarianism, division and disadvantage
- Equality, rights and victims
- Improving service delivery; and
- Reinvestment and Reform
- Economic competitiveness
- Building Equality and Community Cohesion
- Better Public Services
- Economic Growth
- High quality public services;
- Public sector reform; and
- Society based on partnership, equality, inclusion and mutual respect
In the period from 2003-04 to 2005-06, approximately 1-2% of revenue budgets across the Northern Ireland block remained unused at year end. This represented between £113 million and £150 million per annum. In the same period, between 15-20% of capital budgets remained unused, amounting to some £170 million - £230 million.
To address this issue, the Department of Finance and Personnel (DFP) commissioned PKF consultants to undertake an external review of forecasting and monitoring by government departments in Northern Ireland. Reported in June 2007, the overriding finding of the report was that there was insufficient priority afforded to forecasting and monitoring.
However, the study also highlighted the fact that ‘average’ underspend figures fail to reflect the variance across departments. Whilst identifying considerable scope for improvement, the report also acknowledged that the performance of some departments was acceptable. The tables below breaks down the resource and capital underspend figures, by department; the degree of variance in inter-departmental underspend is clear 5:
Table 6.1 Departmental Underspend: Current Expenditure 2005 – 2007 6
2005-06
2006-07
Department 7
£ million
%
£ million
%
DARD
14.3
6.3
11.8
5.1
DCAL
3.9
4.0
2.3
2.3
DE
30.2
1.9
70.7
4.3
DEL
23.9
3.9
15.6
2.5
DETI
2.0
1.0
9.0
4.6
DFP
13.3
8.0
19.3
10.6
DHSSPS
10.4
0.3
6.3
0.2
DOE
3.9
3.0
2.1
1.7
DRD
11.3
3.1
7.0
1.9
DSD
20.3
4.3
7.8
1.6
OFMDFM
1.4
2.7
1.7
3.1
FSA
0.4
4.5
0.0
3.3
NIA
1.7
5.2
0.2
2.2
AOCC
0.1
4.1
0.7
2.0
NIAER
0.8
51.5
0.4
15.5
NIAO
0.7
8.6
0.3
3.9
Total Departments
138.7
1.9
155.3
2.0
Table 6.2 Departmental Underspend: Capital Expenditure 2005 – 2007 8
2005-06
2006-07
Department 9
£ million
%
£ million
%
DARD
29.6
43.2
5.7
11.9
DCAL
7.4
31.5
6.6
30.3
DE
38.8
23.0
30.7
19.4
DEL
22.9
30.9
6.4
10.7
DETI
8.3
17.8
1.3
5.3
DFP
32.6
73.4
9.7
18.3
DHSSPS
1.9
1.2
13.1
6.6
DOE
8.4
43.6
4.2
24.1
DRD
32.4
6.9
0.0
0.0
DSD
43.8
25.3
17.5
20.3
OFMDFM
1.0
32.8
0.8
36.5
FSA
0.0
21.7
0.0
54.5
NIA
0.0
-50.0
0.0
22.2
AOCC
0.0
11.5
0.2
78.4
NIAER
0.1
46.8
0.1
78.2
NIAO
0.1
32.5
0.2
21.9
Total Departments
227.4
18.2
96.7
8.9
The tables above show that the level of current underspend in the period from 2005-06 to 2006-07 is comparable with that between 2003-04 and 2005-06. However, the degree of capital underspend has improved significantly; from between 15-20% to 9% in 2006-07.
The concept of ‘over-commitment’ was introduced by the Minister for Finance in July 2002. The idea behind this was that by allocating departments surplus funds, (i.e. an amount in excess of their actual spending power), they would be less likely to incur underspend. In practice, over-commitment was introduced in Budget 2003-06 and has continued thereafter.
Draft Budget 2008-11 proposes that, in order to ensure some degree of in-year flexibility, the level of planned over-commitment should be reduced to £100 million in 2008-09; £80 million in 2009-10; and £60 million in 2010-11. To put this in context, the levels in previous years are outlined below:
Table 6.3 Planned Overcommitment in Previous Years
2003-04
2004-05
2005-06
2006-07
Planned over-commitment
£136.2
£178.3
£186.5
£130.3 1
- http://www.northernireland.gov.uk/news/news-dfp/news-dfp-251007-new-era-new.htm
- Figures in bold are from Draft Budget 2008-11. Other figures are taken from Draft Budget 2006-08 and provided by way of comparison
2007-08 figures have been updated per Draft Budget 2008-11
- Figures in bold are from Draft Budget 2008-11; other figures are taken from Draft Budget 2006-08
- Priorities and Budget 2004-06 was the first document in which Priorities and Budget were integrated.
- PFK Consultants: “Review of Forecasting and Monitoring”, June 2007
- Due to rounding, totals less than £50,000 may be shown as zero.
DFP: www.dfpni.gov.uk/departmental_spend_and_underspends_in_2005.pdf
- Appendix 1 explains abbreviations
- Due to rounding, totals less than £50,000 may be shown as zero.
DFP: www.dfpni.gov.uk/departmental_spend_and_underspends_in_2005.pdf
- Appendix 1 explains abbreviations
Research Paper
21/11/07
Comparative analysis of draft budget 2008-11
Jodie Carson
Research Officer
Research Papers are compiled for the benefit of Members of The Assembly and their personal staff. Authors are available to discuss the contents of these papers with Members and their staff but cannot advise members of the general public.
CONTENTS
- Introduction
- Context
- The Impact of the Comprehensive Spending Review 2007
- The Northern Ireland Departmental Expenditure Limits 2005-11
4.1 Departmental Allocations: Current Expenditure
4.2 Departmental Allocations: Capital Expenditure - Department of Finance and Personnel (DFP) Allocations
5.1 Departmental Priorities
5.2 Current Expenditure
5.3 Capital Expenditure
5.4 Efficiency Targets - Other Trends
6.1 Spending Priorities
6.2 Underspend
6.3 Over-commitment
Annex 1 Reconciliation of planned current expenditure to HM treasury resource control totals
Annex 2 Draft Budget 2008-11: current expenditure allocations
Annex 3 Draft Budget 2008-11: Capital Investment allocations
Annex 4 Department of Finance and Personnel: current and investment expenditure
1. Introduction
This paper highlights a number of comparisons between the recently announced ‘Draft Budget 2008-11’ and the previous ‘Priorities and Budget 2006-08’. It begins by considering the impact of the Comprehensive Spending Review 2007 upon the level of resources available to Northern Ireland. The current and capital allocations are then considered, by department, in Section 4. Section 5 details the specific implications of Draft Budget 2008-11 for the Department of Finance and Personnel. Finally, Section 6 considers trends in the Executive’s priorities and levels of underspend and planned over-commitment.
2. Context
The Minister for Finance and Personnel, Peter Robinson, presented the Draft Budget 2008-11 on 25 October 2007. The Minister identified economic growth as the main theme;
“The Executive is committed to delivering the economic vision of an innovative, entrepreneurial, wealth-generating, export-oriented economy. To achieve this we need to ensure that policies are in place which will encourage private sector growth and expansion. For too long the local private sector has been constrained by the influence of the Northern Ireland public sector. Now is an opportune time to change the focus of economic policy.” 1
This focus is consistent with the priorities identified in the Executive’s Draft Programme for Government (PfG), namely:
- Grow a dynamic innovative economy
- Promote tolerance, inclusion, health and well being
- Invest to build our infrastructure
- Deliver modern, high quality and efficient Public Services
- Protect and enhance our Environment and natural resources
3. The Impact of the Comprehensive Spending Review 2007
The resources available to the Executive for allocation depend primarily upon changes in comparable spending programmes in England. On 9 th October 2007, the outcome of the Comprehensive Spending Review was announced, confirming that the resources available for Northern Ireland would be less than in recent years. The resultant Departmental Expenditure Limits (DEL) for Northern Ireland from 2007-08 to 2010-11 are as follows:
Table 2.1 Northern Ireland Departmental Expenditure Limits ( DEL) 2007-08 to 2010-11
(£millions) |
2007-08 |
2008-09 |
2009-10 |
2010-11 |
Departmental Expenditure Limit ( DEL) |
8,036.9 |
8,275.1 |
8,553.7 |
8,927.2 |
Percentage Increase on previous year |
|
+3% |
+3.4% |
+4.4% |
Source: Draft Budget 2008-11
In relation to previous annual increases, the 3% increment in Northern Ireland’s DEL between 2007-08 and 2008-09 is relatively low. Priorities and Budget (P&B) 2006-08 set out plans for 4.8% annual increases in current expenditure between 2005-07 and 2006-08.
To reflect the true resource DEL, Annex 1 shows the reconciliation of planned current expenditure to HM Treasury Resource Control Totals.
4. The Northern Ireland Departmental Expenditure Limits 2005-11
Departmental budgets are separated into current and capital budgets:
- Current budgets , or resource budgets, include most direct expenditure on public sector pay and providing services, e.g. health or education reflecting continuing programmes;
- Capital budgets include expenditure on new construction, land, extensions / alterations of existing buildings, and the purchase of fixed assets such as plant and machinery. It also includes expenditure on stocks and grants / lending for capital purposes.
4.1 Departmental Allocations: Current Expenditure
Annex 2 shows the departmental allocations for current expenditure, as outlined in Draft Budget 2008-11. To enable a comparative analysis, table 4.1 overleaf shows these projections alongside those for 2005-06 and 2006-07 presented in Priorities and Budget 2006-08. The key trends which emerge are as follows:
- The nominal increase in total DEL from 2006-07 to 2007-08 is 2.7% versus a budgeted increase of 4.8% between 2005-06 and 2006-07;
- In terms of the planned current expenditure allocations for 2007-08, the biggest ‘losers’ are the Departments of Regional Development and Finance and Personnel, with reductions of 27.3% and 17.1% respectively;
- The Departments of Employment and Learning and Education have both been awarded an additional 6.4% on the previous year’s DEL allocations. The Department of Health has been allocated an additional 5.9%.
- Subsequent changes to departmental shares are less significant, as below:
Figure 4.1 Departmental Allocations of DEL (Nominal)
Table 4.1 Draft Departmental Expenditure Limits 2005-11 2
|
2005-06 |
2006-07 |
% Change |
2007-08 |
% Change |
2008-09 |
% Change |
2009-10 |
% Change |
2010-11 |
% Change |
|---|---|---|---|---|---|---|---|---|---|---|---|
|
|
|
|
|
|
|
|
|
|
|
|
DARD |
255.7 |
233.3 |
-8.8 |
226.4 |
-3.0 |
235.7 |
4.1 |
237.8 |
0.9 |
244.7 |
2.9 |
DCAL |
99.5 |
102.7 |
3.2 |
108.3 |
5.5 |
107.3 |
-0.9 |
109.4 |
2.0 |
117.5 |
7.4 |
DE |
1566.8 |
1632.8 |
4.2 |
1719.2 |
5.3 |
1770.5 |
3.0 |
1870.5 |
5.6 |
1952.3 |
4.4 |
DEL |
646.4 |
687.4 |
6.3 |
731.5 |
6.4 |
734.4 |
0.4 |
771.2 |
5.0 |
818.8 |
6.2 |
DETI |
199.9 |
199.8 |
-0.1 |
199.6 |
-0.1 |
214.2 |
7.3 |
223.9 |
4.5 |
229.8 |
2.6 |
DFP |
205.9 |
211.7 |
2.8 |
175.4 |
-17.1 |
179.5 |
2.3 |
162.4 |
-9.5 |
160.5 |
-1.2 |
DHSSPS |
3340.3 |
3591.9 |
7.5 |
3804.8 |
5.9 |
3938.8 |
3.5 |
4064.1 |
3.2 |
4259.2 |
4.8 |
DOE |
133.3 |
126.6 |
-5.0 |
134.7 |
6.4 |
137.2 |
1.9 |
136.2 |
-0.7 |
135.1 |
-0.8 |
DRD |
375.5 |
382.3 |
1.8 |
278.0 |
-27.3 |
287.6 |
3.5 |
309.2 |
7.5 |
335.2 |
8.4 |
DSD |
510.2 |
516.8 |
1.3 |
521.0 |
0.8 |
529.5 |
1.6 |
522.6 |
-1.3 |
522.3 |
-0.1 |
OFMDFM |
70.8 |
74.8 |
5.6 |
70.9 |
-5.2 |
73.9 |
4.2 |
79.4 |
7.4 |
84.3 |
6.2 |
NIA |
47.6 |
47.6 |
0.0 |
47.6 |
0.0 |
47.6 |
0.0 |
47.6 |
0.0 |
47.6 |
0.0 |
Other Departments |
17.4 |
19 |
9.2 |
19.6 |
3.2 |
18.9 |
-3.6 |
19.4 |
2.6 |
19.8 |
2.1 |
|
|
|
|
|
|
|
|
|
|
|
|
Total DEL |
7469.3 |
7826.7 |
4.8 |
8036.9 |
2.7 |
8275.1 |
3.0 |
8553.7 |
3.4 |
8927.2 |
4.4 |
4.2 Departmental Allocations: Capital Expenditure
Annex 3 presents the draft departmental allocations for capital expenditure. Table 4.2 compares these with those outlined in Priorities and Budget 2006-08:
- It should be noted that the values presented in Draft Budget 2008-11 are expressed “net of receipts”. This explains the negative trend emerging in 2008-09 in respect of DFP, and in 2010-11 in respect of DARD :
Figure 4.2 Departmental Allocations of Capital Investment (Nominal)
Table 4.2 Draft Capital Investment Allocations (Net of Receipts) 2005-11 3
|
2005-06 |
2006-07 |
% change |
2007-08 |
% change |
2008-09 |
% change |
2009-10 |
% change |
2010-11 |
% change |
|---|---|---|---|---|---|---|---|---|---|---|---|
|
Capital Inv |
Capital Inv |
|
Capital Inv |
|
Capital Inv |
|
Capital Inv |
|
Capital Inv |
|
DARD |
49.4 |
73.3 |
48.4 |
83.0 |
13.2 |
83.6 |
0.7 |
28.6 |
-65.8 |
-171.1 |
-698.3 |
DCAL |
17.8 |
31.8 |
78.7 |
43.0 |
35.2 |
64.5 |
50.0 |
74.1 |
14.9 |
79.9 |
7.8 |
DE |
162.3 |
213.5 |
31.5 |
279.8 |
31.1 |
213.6 |
-23.7 |
252.3 |
18.1 |
200.1 |
-20.7 |
DEL |
60.2 |
75.5 |
25.4 |
68.9 |
-8.7 |
40.7 |
-40.9 |
38.7 |
-4.9 |
44.6 |
15.2 |
DETI |
43.4 |
62.1 |
43.1 |
77.5 |
24.8 |
48.0 |
-38.1 |
87.9 |
83.1 |
78.2 |
-11.0 |
DFP |
22.6 |
42.2 |
86.7 |
51.1 |
21.1 |
-145.0 |
-383.8 |
22.7 |
-115.7 |
16.0 |
-29.5 |
DHSSPS |
176.3 |
188.2 |
6.7 |
177.8 |
-5.5 |
202.6 |
13.9 |
203.7 |
0.5 |
213.2 |
4.7 |
DOE |
14.1 |
11.0 |
-22.0 |
9.8 |
-10.9 |
10.7 |
9.2 |
22.5 |
110.3 |
171.2 |
660.9 |
DRD |
455.6 |
403.3 |
-11.5 |
373.1 |
-7.5 |
568.7 |
52.4 |
416.0 |
-26.9 |
419.9 |
0.9 |
DSD |
125.8 |
192.4 |
52.9 |
231.3 |
20.2 |
153.7 |
-33.5 |
145.3 |
-5.5 |
223.4 |
53.8 |
OFMDFM |
3.2 |
8.8 |
175.0 |
11.7 |
33.0 |
12.4 |
6.0 |
23.2 |
87.1 |
17.3 |
-25.4 |
NIA |
2.0 |
2.0 |
0.0 |
2.0 |
0.0 |
0.3 |
-85.0 |
0.3 |
0.0 |
0.3 |
0.0 |
Other Departments |
0.2 |
0.4 |
100.0 |
0.4 |
0.0 |
0.4 |
0.0 |
0.4 |
0.0 |
0.4 |
0.0 |
|
|
|
|
|
|
|
|
|
|
|
|
Total Allocations |
1132.9 |
1304.5 |
15.1 |
1409.4 |
8.0 |
1254.2 |
-11.0 |
1315.7 |
4.9 |
1293.4 |
-1.7 |
Source: Draft Budget 2008-11 and Priorities and Budget 2006-08
5. Department of Finance and Personnel (DFP) Allocations
In Priorities and Budget 2006-08 (P&B 2006-08), the key objectives of DFP were as follows:
- To prioritise the use of resources available to NI, ensure that these are used efficiently and secure the reform and modernisation of public services.
- To deliver efficient and cost effective services to the public in the Department’s area of executive responsibility.
Draft Budget 2008-11 highlights, for DFP, the importance of:
- Leading Reform;
- Delivering Value; and
- Promoting Sustainability
The key focus for 2008-11 will be the delivery of Civil Service Reform within DFP and the Northern Ireland Civil Service (NICS). DFP will also lead on simplifying and improving citizen access to public services in Northern Ireland, including the introduction of a single telephone number point of contact for selected services by the end of 2008.
Draft Budget 2008-11 prescribes a significant reduction in the share of DEL allocated to DFP. With the exception of the Department for Regional Development, (DRD), DFP has suffered the largest cut; the current year allocation is 17.1% lower than that allocated for 2006-07, and this trend will continue in subsequent years:
Figure 5.1 Share of Current Expenditure Allocated to DFP
Source: Derived from Draft Budget 2008-11 & Priorities and Budget 2006-08
The Department’s proposed capital allocation is intended, as part of the Civil Service Reform, to enable the replacement and modernisation of business processes across the NICS. It should also enable the capital accommodations programmes associated with the NICS estate, and the enhancement / maintenance of the Department’s ICT systems. Additionally, capital expenditure will be incurred to improve both the energy performance of, and the level of carbon omissions from, buildings occupied by public bodies.
Figure 5.2 Share of Capital Investment Allocated to DFP
Source: Derived from Draft Budget 2008-11 & Priorities and Budget 2006-08
The negative investment value for 2008-09 is due to the projected £162m cash injection in respect of NICS accommodation services.
The graphs above have shown the relative decline in the resources available to DFP, however, it is intended that this be supplemented by the achievement of efficiencies. The Department has a target to deliver cash releasing efficiencies of £5.7 million, £10.3 million and £14.8 million respectively, over the period 2008-09 to 2010-11.
It is anticipated that savings will accrue from the ongoing review of administrative expenditure and staff budgets, and by improving organisational structure. Additionally, by improving productivity and rationalising NICS office accommodation, DFP should realise additional spending power.
Annex 4 details the specific current and capital expenditure plans for the Department of Finance and Personnel.
6. Other Trends
Draft Budget 2008-11 has shown the economy to be the key focus; this has become increasingly prioritised over recent years. The figure below reflects the Executive’s changing priorities, per the Budget and Programme for Government, and Priorities and Budget documents 4.
Figure 6.1 Trends in Executive’s Priorities 2003-08
2003-06 |
2004-06 |
2005-08 |
2006-08 |
|---|---|---|---|
|
|
|
|
In the period from 2003-04 to 2005-06, approximately 1-2% of revenue budgets across the Northern Ireland block remained unused at year end. This represented between £113 million and £150 million per annum. In the same period, between 15-20% of capital budgets remained unused, amounting to some £170 million - £230 million.
To address this issue, the Department of Finance and Personnel (DFP) commissioned PKF consultants to undertake an external review of forecasting and monitoring by government departments in Northern Ireland. Reported in June 2007, the overriding finding of the report was that there was insufficient priority afforded to forecasting and monitoring.
However, the study also highlighted the fact that ‘average’ underspend figures fail to reflect the variance across departments. Whilst identifying considerable scope for improvement, the report also acknowledged that the performance of some departments was acceptable. The tables below breaks down the resource and capital underspend figures, by department; the degree of variance in inter-departmental underspend is clear 5:
Table 6.1 Departmental Underspend: Current Expenditure 2005 – 2007 6
|
2005-06 |
2006-07 |
||
Department 7 |
£ million |
% |
£ million |
% |
DARD |
14.3 |
6.3 |
11.8 |
5.1 |
DCAL |
3.9 |
4.0 |
2.3 |
2.3 |
DE |
30.2 |
1.9 |
70.7 |
4.3 |
DEL |
23.9 |
3.9 |
15.6 |
2.5 |
DETI |
2.0 |
1.0 |
9.0 |
4.6 |
DFP |
13.3 |
8.0 |
19.3 |
10.6 |
DHSSPS |
10.4 |
0.3 |
6.3 |
0.2 |
DOE |
3.9 |
3.0 |
2.1 |
1.7 |
DRD |
11.3 |
3.1 |
7.0 |
1.9 |
DSD |
20.3 |
4.3 |
7.8 |
1.6 |
OFMDFM |
1.4 |
2.7 |
1.7 |
3.1 |
FSA |
0.4 |
4.5 |
0.0 |
3.3 |
NIA |
1.7 |
5.2 |
0.2 |
2.2 |
AOCC |
0.1 |
4.1 |
0.7 |
2.0 |
NIAER |
0.8 |
51.5 |
0.4 |
15.5 |
NIAO |
0.7 |
8.6 |
0.3 |
3.9 |
Total Departments |
138.7 |
1.9 |
155.3 |
2.0 |
|---|---|---|---|---|
Table 6.2 Departmental Underspend: Capital Expenditure 2005 – 2007 8
|
2005-06 |
2006-07 |
||
Department 9 |
£ million |
% |
£ million |
% |
DARD |
29.6 |
43.2 |
5.7 |
11.9 |
DCAL |
7.4 |
31.5 |
6.6 |
30.3 |
DE |
38.8 |
23.0 |
30.7 |
19.4 |
DEL |
22.9 |
30.9 |
6.4 |
10.7 |
DETI |
8.3 |
17.8 |
1.3 |
5.3 |
DFP |
32.6 |
73.4 |
9.7 |
18.3 |
DHSSPS |
1.9 |
1.2 |
13.1 |
6.6 |
DOE |
8.4 |
43.6 |
4.2 |
24.1 |
DRD |
32.4 |
6.9 |
0.0 |
0.0 |
DSD |
43.8 |
25.3 |
17.5 |
20.3 |
OFMDFM |
1.0 |
32.8 |
0.8 |
36.5 |
FSA |
0.0 |
21.7 |
0.0 |
54.5 |
NIA |
0.0 |
-50.0 |
0.0 |
22.2 |
AOCC |
0.0 |
11.5 |
0.2 |
78.4 |
NIAER |
0.1 |
46.8 |
0.1 |
78.2 |
NIAO |
0.1 |
32.5 |
0.2 |
21.9 |
Total Departments |
227.4 |
18.2 |
96.7 |
8.9 |
|---|---|---|---|---|
The tables above show that the level of current underspend in the period from 2005-06 to 2006-07 is comparable with that between 2003-04 and 2005-06. However, the degree of capital underspend has improved significantly; from between 15-20% to 9% in 2006-07.
The concept of ‘over-commitment’ was introduced by the Minister for Finance in July 2002. The idea behind this was that by allocating departments surplus funds, (i.e. an amount in excess of their actual spending power), they would be less likely to incur underspend. In practice, over-commitment was introduced in Budget 2003-06 and has continued thereafter.
Draft Budget 2008-11 proposes that, in order to ensure some degree of in-year flexibility, the level of planned over-commitment should be reduced to £100 million in 2008-09; £80 million in 2009-10; and £60 million in 2010-11. To put this in context, the levels in previous years are outlined below:
Table 6.3 Planned Overcommitment in Previous Years
|
2003-04 |
2004-05 |
2005-06 |
2006-07 |
Planned over-commitment |
£136.2 |
£178.3 |
£186.5 |
£130.3 1 |
- http://www.northernireland.gov.uk/news/news-dfp/news-dfp-251007-new-era-new.htm
- Figures in bold are from Draft Budget 2008-11. Other figures are taken from Draft Budget 2006-08 and provided by way of comparison
2007-08 figures have been updated per Draft Budget 2008-11 - Figures in bold are from Draft Budget 2008-11; other figures are taken from Draft Budget 2006-08
- Priorities and Budget 2004-06 was the first document in which Priorities and Budget were integrated.
- PFK Consultants: “Review of Forecasting and Monitoring”, June 2007
- Due to rounding, totals less than £50,000 may be shown as zero.
DFP: www.dfpni.gov.uk/departmental_spend_and_underspends_in_2005.pdf - Appendix 1 explains abbreviations
- Due to rounding, totals less than £50,000 may be shown as zero.
DFP: www.dfpni.gov.uk/departmental_spend_and_underspends_in_2005.pdf - Appendix 1 explains abbreviations