Session 2010/2011
Third Report
Committee for Finance and Personnel
Report on the Executive's Draft Budget 2011-15
Volume 3
Written Submissions, Research Papers and Memoranda
Ordered by The Committee for Finance and Personnel to be printed 16 February 2011
Committee for Finance and Personnel
Report: NIA 44/09/10R
Membership and Powers
Powers
The Committee for Finance and Personnel is a Statutory Departmental Committee established in accordance with paragraphs 8 and 9 of the Belfast Agreement, Section 29 of the Northern Ireland Act 1998 and under Assembly Standing Order 48. The Committee has a scrutiny, policy development and consultation role with respect to the Department of Finance and Personnel and has a role in the initiation of legislation.
The Committee has the power to;
- consider and advise on Departmental budgets and annual plans in the context of the overall budget allocation;
- approve relevant secondary legislation and take the Committee Stage of primary legislation;
- call for persons and papers;
- initiate inquiries and make reports; and
- consider and advise on matters brought to the Committee by the Minister of Finance and Personnel.
Membership
The Committee has eleven members, including a Chairperson and Deputy Chairperson, with a quorum of five members. The membership of the Committee during the current mandate has been as follows:
- Mr Daithí McKay (Chairperson)1
- Mr David McNarry (Deputy Chairperson)2
- Dr Stephen Farry
- Mr Paul Frew3
- Mr Paul Girvan4
- Mr Simon Hamilton
- Ms Jennifer McCann
- Mr Mitchel McLaughlin
- Mr Adrian McQuillan
- Mr Declan O'Loan
- Ms Dawn Purvis
1. Mr Daithí McKay replaced Ms Jennifer McCann as Chairperson on 19 January 2011, having replaced Mr Fra McCann on the Committee on 13 September 2010. Ms McCann replaced Mr Mitchel McLaughlin as Chairperson on 9 September 2009.
2. Mr David McNarry was appointed Deputy Chairperson on 12 April 2010 having replaced Mr Roy Beggs on the Committee on 29 September 2008.
3. Mr Paul Frew joined the Committee on 13 September 2010; Mr Ian Paisley Jr left the Committee on 21 June 2010 having replaced Mr Mervyn Storey on 30 June 2008.
4. Mr Paul Girvan replaced Mr Jonathan Craig on 13 September 2010; Mr Jonathan Craig had been appointed as a member of the Committee on 13 April 2010. Mr Peter Weir left the Committee on 12 April 2010. Mr Peter Weir had replaced Mr Simon Hamilton as Deputy Chairperson on 4 July 2009. Mr Simon Hamilton replaced Mr Mervyn Storey as Deputy Chairperson on 10 June 2008.
Table of Contents
List of Abbreviations and Acronyms used in the Report
Appendix 6
Appendix 7
Appendix 8
List of Abbreviations and Acronyms used in the Report
ACNI Arts Council Northern Ireland
A&E Accident and Emergency
ALB Arm's Length Body
AME Annually Managed Expenditure
AMU Assets Management Unit
ASB Aggregated Schools Budget
BBA British Bankers' Association
CART Capital Assets Realisation Taskforce
CBI Confederation of British Industry Northern Ireland
CDO Collateralised Debt Obligations
CEF Construction Employers Federation
CFG Central Finance Group
CFP Committee for Finance and Personnel
CIF Construction Industry Forum
CSR Comprehensive Spending Review
DARD Department of Agriculture and Rural Development
DCAL Department of Culture, Arts and Leisure
DE Department of Education
DEL Departmental Expenditure Limits
DEL Department for Employment and Learning
DETI Department of Enterprise, Trade and Investment
DFP Department of Finance and Personnel
DHSSPS Department of Health, Social Services and Public Safety
DLA Disability Living Allowance
DoE Department of the Environment
DoJ Department of Justice
DRD Department for Regional Development
DSD Department for Social Development
DWP Department of Work and Pensions
EDP Efficiency Delivery Plan
EIB European Investment Bank
E&LB Education and Library Board
EQIA Equality Impact Assessments
ERINI Economic Research Institute of Northern Ireland
ESRI Economic and Social Research Institute
ESS Enterprise Shared Services
ETI Enterprise, Trade and Investment
EU European Union
EYF End of Year Flexibility
FDI Foreign Direct Investment
FSB Federation of Small Businesses
FSME Free School Meal Entitlement
FTE Full time equivalent
GB Great Britain
GP General Practitioner
GDP Gross Domestic Product
GVA Gross Value Added
HE Higher Education
HLIA High Level Impact Assessment
HM Her Majesty's
HMT Her Majesty's Treasury
HR Human Resources
ICT Information Communication Technology
ICTU Irish Congress of Trade Unions
IFS Institute for Fiscal Studies
IMF International Monetary Fund
IoD Institute of Directors
ISNI Investment Strategy for Northern Ireland
LPS Land and Property Services
JESSICA Joint European Support for Sustainable Investment in City Area
MAC Metropolitan Arts Centre
MLA Member of the Legislative Assembly
NAMA National Assets Management Agency
NGO Non-Governmental Organisation
NI Northern Ireland
NIAO Northern Ireland Audit Office
NICMA Northern Ireland Childminding Association
NICS Northern Ireland Civil Service
NICVA Northern Ireland Council for Voluntary Action
NIFHA Northern Ireland Federation of Housing Associations
NIHE Northern Ireland Housing Executive
NILGA Northern Ireland Local Government Association
NIMFG Northern Ireland Manufacturing Focus Group
NIPSA Northern Ireland Public Service Alliance
NITA Northern Ireland Theatre Association
NIW Northern Ireland Water
OCA Office Cost Allowance
OFMDFM Office of the First Minister and deputy First Minister
PAC Public Accounts Committee
PEDU Performance and Efficiency Delivery Unit
PfG Programme for Government
PFI Private Finance Initiative
PMS Presbyterian Mutual Society
PPP Public Private Partnerships
PRONI Public Record Office of Northern Ireland
PSA Public Service Agreement
PSE UK Poverty and Social Exclusion in the UK Project
PSNI Police Service of Northern Ireland
PSO Public Service Obligations
PwC PricewaterhouseCoopers
QUB Queen's University, Belfast
RoI Republic of Ireland
RRI Reinvestment and Reform Initiative
SCS Senior Civil Service
SEN Special Educational Needs
SHDP Social Housing Development Programme
SIB Strategic Investment Board
SME Small and Medium-sized Enterprises
SOU Special Olympics Ulster
SROI Social Return on Investment
SSRB Senior Salaries Review Body
STAR Skills, Training and Reinvestment
UK United Kingdom
USA United States of America
Appendix 6
Written Submissions
The Methodist Church in Ireland - Review of 2010-11 Spending Plans
Action for Children to Finance Minister
9 September 2010
Mr Sammy Wilson, MP, MLA |
Action for Children Northern Ireland |
Dear Minister
Action for Children is keen to engage constructively with the Northern Ireland Executive in order to share our impact evidence and solutions to help with the delivery of efficiencies to the economy. Following our letter to you (5th March 2010) about the NI Government Department Spending Review 2010/1011, I am writing to set out Action for Children's input to the Comprehensive Spending Review process in Northern Ireland.
I welcome the opportunities presented to us to engage in dialogue over the reductions to public expenditure and would welcome the opportunity to discuss our evidence as proposals are considered by Ministers pending the outcome of the CSR, determination of the Northern Ireland Bloc grant and preparation of the draft Northern Ireland Budget .
In line with our submission already with the Chancellor George Osborne in July 2010, key points summarised here and outlined in more detail in the enclosed paper:
Saving money and transforming lives through early intervention
- Prioritise funding for those early intervention services which are intensive, targeted and founded on a robust evidence base; provided before problems such as chronic neglect of children become intractable with the high financial costs that are then incurred.
Building communities and making existing resources go further
- Protect the investment in Sure Start and Family Support services so that they continue to provide localised, community shaped early-years and family support services that can deliver targeted support to the most disadvantaged people.
Preventing family breakdown
- Prevent family breakdown, avoidable social problems and multi layered financial burden of picking up the pieces by shifting the balance of funding from acute to early intervention services that offered as soon as a problem has been identified.
Designing public services fit for the future
- In such a tight fiscal environment we must urgently transform commissioning to incentivise longterm impact so that less funding does not mean less innovation.
- Develop an impact framework to support those elements, which make the greatest difference: stability of service provision and effective professional relationships.
More than ever, we have a responsibility to be clear that the public money we are entrusted to spend has a demonstrably effective and efficient return on its investment. At Action for Children such accountability is central to our work and we continue to pioneer methods that allow us to show what impact we are actually making. As you look to apply those principles across government here, I would welcome the opportunity to share our evidence and learning.
At Action for Children, we are committed to protecting the most vulnerable and neglected children, young people and families in our society. We would urge you to ensure future funding decisions are in line with Section 75 requirements and do not have an adverse or disproportionate impact on disadvantaged or vulnerable groups including children and young people and their families.
I hope you find our contribution useful in steering the difficult Spending Review decisions ahead, in preparation for the next Northern Ireland Budget and revised Programme for Government. I look forward to further discussions with your department and colleagues in the Northern Ireland Executive.
I have also written to your colleagues on the Northern Ireland Executive, department Children's Champions and members of the NI Assembly departmental Scrutiny Committees.
Yours sincerely

Louise Warde Hunter
Strategic Director Children Services
Action for Children Scotland & NI
cc: Laura McPolin, Department of Finance
Clerk of NI Assembly Finance Committee
Action for Children's Response to CSR NI
Comprehensive Spending Review and next Northern Ireland Budget
Action for Children's approach is underpinned by the principle of protecting the most vulnerable and neglected children, young people and families in our society.
1. Saving money and transforming lives through early intervention
1.1 It is important for the Northern Ireland Executive to demonstrate that it is making a rational decision, not just taking easy choices when making cuts to available public expenditure in Northern Ireland over the next number of years. We believe this represents a once-in-a-generation opportunity to deliver efficiency to the economy by investing in early intervention services, which not only makes economic sense but will transform lives.
1.2 In Northern Ireland around 25,000 children will be born every year. Each one of these children will be full of potential, but right from the start some will struggle - around 1,800 children will already have begun the journey their parents took to the margins of society[1]. Across the UK around one million children are at risk of intergenerational deprivation and neglect which equates to about 51,000 children in Northern Ireland.
1.3 Almost half the children who demonstrate anti-social behavior in the early years will continue their behaviour into adulthood, ending up as a serial offender. A serial offender will cost society between £1.1 million and £1.9 million over a lifetime. The cost of this criminal activity is estimated at £84 million a year in the UK.
1.4 There is now overwhelming evidence that early intervention works, so we can get better results for the money we spend. Research carried out across the UK for Action for Children by the New Economics Foundation (nef) shows that if we focus on early intervention, the economy could save £486 billion over 20 years[2]. By being smarter in the way we invest, we can release the potential of a new generation. The research included an independent evaluation of three types of services run by Action for Children and showed that, taking into account reduced health costs of children, reduced crime and anti-social behaviour, reduction of costs and care, increased tax revenue through employment and decreased benefits, the services returned between £4 and £9 of social value for every £1 invested in them.
1.5 The Northern Ireland Executive must prioritise funding for children's services and those early intervention services which are intensive, targeted and founded on a robust evidence base; provided before problems become intractable.
2. Building communities and making existing resources go further
2.1 The Northern Ireland Executive must protect investment in Sure Start and family support services so they provide the localised, community shaped early years and family support services that can also deliver targeted support to the most disadvantaged.
2.2 The increased investment in family support services through the Families Matter and Care Matters strategies in Northern Ireland is having a significant, positive impact on vulnerable children as is the funding in Sure Start for children in early years settings. While this investment is welcome, the Executive also needs to recognise that there has been an historic under funding of children's services in Northern Ireland of around 30% compared to other parts of the UK[3].
2.3 Sure Start and family centre-based support services are accepted, accessible assets sitting at the heart of communities experiencing social and economic deprivation in Northern Ireland. Such assets must be reconfigured to harness the return on investment already made (in terms of buildings, people, networks and essential front line support services). Funding for Sure Start and family support provision must be protected to ensure the investment in these local service hubs is not wasted.
2.4 Action for Children is closely involved in developing family support hubs in Northern Ireland through our engagement in children services planning - enabling local needs to be met through the strategic development of services and implementation of Families Matters agenda in Northern Ireland. Co-location of services, such as relationship support, services for children with special education needs, legal services, sexual health clinics, child and family health services and debt advice, efficiencies can be made while also improving focus and impact.
Early Support for disabled children is essential if they are to flourish in a school settingAction for Children's extensive range of services for children with a disability starts from the early years and extends through to young people's transition to adulthood. We understand that services can be delivered effectively in different ways from a number of bases. We aim to ensure all our universal services are available to disabled children and their families, promoting opportunities for them to be included from the earliest age. This includes the support delivered through our Sure Start and family support services. Our four Sure Start services in Northern Ireland work to provide integration and inclusion for children with disabilities within existing services such as with the mobile sensory unit. Our service help with coordinating provision for children and young people with disabilities, providing workers to accompany the children to the centre where they would not otherwise be able to attend on their own. In the longer term such services develops their confidence, skills and experience – all essential to developing school readiness and enhancing longer term education prospects. Our other pre school provision for children with disabilities include: early years crèches, specialist parenting programmes (such as the Little Acorns in Ballymena for parents of children on the autistic spectrum) and access to speech and language services. |
2.5 In order to live up to the promise of delivering to the most vulnerable families, intensive, targeted support services, with evidence of impact, must be embedded within local family support and Sure Start services to truly transform them into community hubs that each out to the most vulnerable and neglected.
2.6 This is not just about efficiencies; this approach will achieve better results by bridging between universal and targeted services, thus addressing the drop off in impact once an intensive intervention has ended. The universal reach is important in terms of avoiding stigma as well as ensuring the earlier identification of emerging problems.
2.7 There are clear advantages for both child outcomes and value for money in being able to offer families a variety of support services from their local Sure Start or family centres. They should be the one-stop shop for children and families, with services tailored and developed in partnership to meet the needs of local families. Through reaching out effectively within local areas, it is possible to take services to families who are unable to access family support services or who need encouragement to do so. To deliver this localism and the flexibility it requires, it will be essential to have sufficient numbers of Sure Start and Family Support Services to have local reach / community profile.
3. Preventing family breakdown
3.1 In order to build sustainable, inclusive communities which will help protect the most vulnerable through difficult times, targeted support must be provided to the most vulnerable families at risk of breakdown.
3.2 This need is ever more pressing given the twin pressures of the need for savings in the current economic climate, and, the increased demand for children's services because of better identification of children in need and increasing numbers of children subject to child protection plans and entering the care system. At a more general level, there are higher demands on health and social care services arising from increasing birth rates and population growth with children much more likely to use services than other groups.
3.3 There is also the growing evidence base of what works, where effective targeted interventions are focused around the pressure points for families and young people. For example, Family Intervention projects, which work with families with multiple and complex problems coast about £8,000 per family. Independent evaluations show that they are successful in 70% of cases, and they reduce levels of physical abuse by 43%. And that's not taking into account the reduction in neglect and suffering of young people at the hands of parent's who can not cope[4].
Action for Children's Early Enervation work in Northern IrelandIn Northern Ireland, Action for Children works with local Health and Social Care Trusts to prevent children from coming into care and getting into trouble. When such children are identified, Action for Children intervenes to strengthen the family unit and enable them to see the positives in their lives including re-engagement with education and preventing offending and anti-social behaviour. These services use a range of interventions including solution-focused brief therapy model of work. Support is offered for an agreed period of time with al interventions regularly reviewed. When work is completed families are tracked to see if progress they made is maintained. |
3.4 We know that rates of family breakdown are significantly higher in families with disabled children; 25% of lone parent families have a disabled child. Disabled children and their families are more likely to live in poverty and so also be adversely affected by an economic downturn because they are at greater risk of living in poverty[5]. It is estimated that 57% of disabled children are living in poverty compared to around 37% of children without disabilities and that it costs three times as much to bring up a disabled child as a non disabled child[6]. Approximately 59% of children living with a chronically ill or disabled parent are poor[7]
3.5 As a leading provider of short breaks services, Action for Children understands how valuable these services are to disabled children and young people and their families. We therefore commissioned research [8] that explored the social and economic value created by short breaks.
3.6 The research concludes that significant savings could be made to the State if short breaks were provided to all families with disabled children who need them. It also provides a clear case for sustainable funding for the effective delivery of short breaks services. Finally, it concludes that failure to support these families in the long term would result in substantial additional costs to the State.
Through independent analysis of data, nef consulting calculated that the government could make an estimated annual saving of £174 million if short breaks were effectively delivered to all those eligible to receive them. This saving has been based on both the decreased cost of longterm residential care from reductions in the number of disabled children placed outside the family home (£135 million) and the decreased cost to health services from reduction in parents', families' and carers' stress (£18 million).
While based on data in England, the above findings also highlight how similar investments and savings in effectively delivery of short breaks could be made in Northern Ireland.
4. Designing public services fit for the future
4.1 In such a tight fiscal environment we must urgently transform commissioning to incentives long term impact so that less funding does not mean less innovation
4.2 Experience at developing and using effective tools that evaluate the services we provide, the voluntary sector has played a significant part in moving inputs (the activities and programmes offered) and outputs (how many people participated) to analysis impact and outcomes for individual families.
4.3 The commissioning process must incorporate some element of Social return on Investment. We want to see an impact framework developed to support those elements which makes the greatest difference. A stable professional relationship based on trust is what makes the difference in delivering successful public services. To help those most in need, intensive, services need to provide personalised family support based on sustained relationships with highly trusted, skilled workers.
4.4 At Action for Children we have developed an holistic approach towards measuring impact; bringing together data were that data was genuinely associated with improved outcomes (e.g. numbers of young people in employment, education or training or numbers sustaining employment two years or more further to intervention) with more qualitative information drawn from internal and independent evaluations and research into our service provision and with feedback fro service users, staff and partners.
4.5 Common strands identified as having the greatest impact were:
- Use of relationship over time, including outreach, to work successfully with the most vulnerable and excluded
- Commitment to both intensive and long-term support where necessary
- Flexibility to provide services to meet need through intensive contacts
- Sound basis in safeguarding principles and procedures
- Commitment to ensuring the achievement of qualitative outcomes over and above success in meeting timescales and other process measures
- Stable staffing within services albeit contracts are often too short-term to guarantee services
4.6 This information was then assembled in a comprehensive Impact report for the organisation and this will now be an annual process. We believe that our experience is worthy of consideration in reviewing performance systems that concentrate on impact and not on efficiency of processes which have served to drive social work attention away from meeting needs of families and to achieving compliance with unhelpful targets.
5. The Nations
5.1 In recognition of block grant funding arrangements, Action for Children's proposals remain constant across the UK. Action for Children's priority is to ensure the allocation of sufficient funds to protect the most vulnerable and neglected children, young people and families in our nations.
[1] Estimate based on Oroyemi, P, Damioli, G, Barnes, M and Crosier, T (2009) Understanding the risks of social exclusion across the life course: families with children, Nat Cen/Cabinet Office; 4%–7% of children are caught up in 'long-term disadvantage
[2] Backing the future: why investing in children is good for us all, New Economics Foundation (nef), Action for Children (2009).
[3] An analysis of Public Expenditure on Children in Northern Ireland (2007), report jointly commissioned by OFMdFM, Department of Finance and Personnel and NICCY. The report highlighted significant disparities in spending which had consequential negative impacts on services for children and young people in Northern Ireland.
[4] Anti-social behaviour intensive family support projects, an evaluation of six projects, Sheffield Hallam University and Salford University, DCLG (2006 )
[5] Counting the Costs, Contact a Family, 2008
[6] Paying in Care: The Cost of Childhood Disability, Dobson and Middleton (1998), Joseph Rowntree Foundation
[7] Child and Family Poverty in Northern Ireland, McLaughlin & Monteith (2006), Equality and Social Need Division, OFMDFM, Belfast
[8] Research undertaken by nef consulting, Part of nef (New Economics Foundation)
CBI - Delivering Public Services in a Time of Austerity
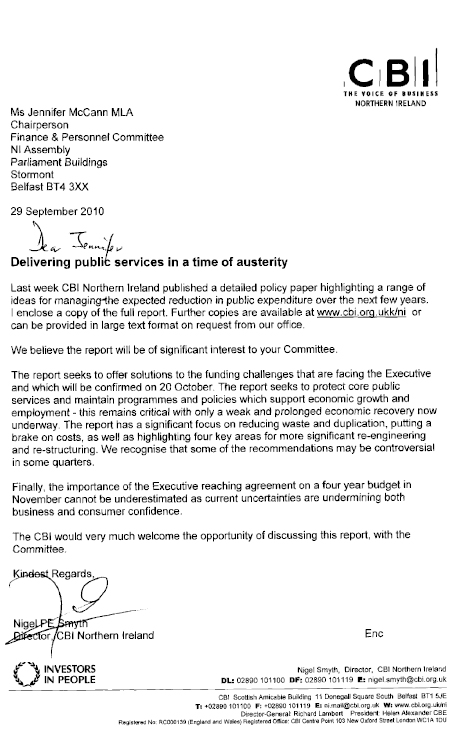
CBI-NI Public Spending Reform Executive Summary


Construction Employers Federation
State of the Construction Industry in Northern Ireland
30 September 2010
Employment
Employment in the construction industry has been decimated in the last two years and half years.
According to the Labour Force Survey the number of people working in construction has fallen from 87,000 in Q4 2007 to 66,000 in Q2 2010. In other words, 21,000 jobs have been lost in only 30 months.
This rate of decline is confirmed in the Quarterly Employment Survey which shows a 27% fall in the number of employees in construction over the same period.
There are currently approximately 13,000 ex-construction workers claiming unemployment benefit.
Current and Future Industry Performance
At Q2 2010 almost half of respondents to the CEF State of Trade Survey (44%) were working at half capacity or less.
According to the Northern Ireland Construction Bulletin, total industry output in Q1 2010 was £695m. This is £179m less than Q2 2007 and equates to a 20% fall.
The outlook for the industry over the next 12 months is bleak. Even though the industry has suffered terribly over the past year an increasing number of companies expect the next 12 months to be worse. According to the State of Trade survey 62% of companies expect a lower workload over the next 12 months.
House Building
The rate of new house building has been cut in half. In 2006 there were 15,300 new house starts. In 2009, only 7,500 new houses were started.
New house completions follow a similar trend, going from a high of 18,300 in 2006 to a low of 9,300 in 2009.
NHBC publishes quarterly figures on new build housing. These figures show that new starts peaked at 3000 in Q2 2005, hit a low of 400 in Q4 2008, and have recovered to 1000 in Q2. There are fears that even this modest recovery is now under threat.
NHBC housing completions have dropped steadily from 2,900 in Q2 2006 to 900 in Q2 2010. There is yet to be any recovery in the rate of housing completions.
NIPSA Comment on HR Connect
Your Ref
Our Ref A/BC/KW
Brian Campfield General Secretary
Mr Shane McAteer
Committee Clerk
Committee for Finance and Personnel
Room 419
Parliament Buildings
Stormont
BELFAST
BT4 3XX
18th October 2010
Dear Shane
HR Connect – NIPSA Comment
Further to your e-mail of 14th October 2010, NIPSA welcomes the opportunity to update the Committee for Finance and Personnel of our experience of the adverse impact on the Northern Ireland Civil Service as a consequence of the NICS contractual arrangement with HR Connect.
As we reported when we last submitted evidence to this Committee, and as we communicated to the Permanent Secretary for the DFP earlier this year, this contract is a mistake that is damaging both efficiency and morale across all Departments.
The following submission reinforces this message by drawing upon both our industrial relations experience of the "new" personnel world brought about by HR Connect and also the extensive research of staff views carried out by both NISRA and Millward Brown Ulster in the latter part of 2009.
We are on the record as stating that these findings are a "wake up" call to Management Side to go back to the drawing board on the provision of future personnel services to the NICS. We repeat our call that what is needed is an accurate, modern payroll system delivered at an appropriate cost with all other functions delivered by a properly resourced, accountable and efficient Personnel Service within the NICS.
Yours sincerely
BRIAN CAMPFIELD
General Secretary
Experience of HR Connect
Introduction
1. In February 2009 NIPSA reported to this Committee that while HR Connect had been launched in 2008 on the basis that "Northern Ireland citizens want and deserve an efficient and effective public service" our experience was that this contract had failed to deliver either efficiency or effectiveness. This remains our view.
The Need to Establish True Cost/'Benefit' of HR Connect
2. At this time, we also emphasised our concern in relation to cost. As the Northern Ireland Audit Office reported in July 2008, the cost of the 15 year HR Connect contract has risen from an original estimate of £328 million to £465 million, with implementation costs alone of £14.7 million. It is not clear, however, since these figures were placed in the public domain, what the full past, current and projected spend has been/will be. We believe these figures should be published.
3. In addition, our major question on cost however, then as now, is that a 'reform' measure, sold on the basis of private sector 'expertise' doing what the public sector could not, has only been capable of delivering any services at all because of NICS investment in shadow arrangements and considerable public sector resources being deployed to "rescue" the Project. In this regard the required breakdown of costs needs to capture: the public sector cost of 'managing' this project; what funds have not been paid to the contractor and what this represents as a testimony to its actual delivery and performance.
4. DFP Officials have claimed previously that they do not know pre-HR Connect, "how good the HR function in the Civil Service was". Benchmark data therefore, did not exist at the point of procurement. Inevitably, therefore, any promise of improvement or even minimal competence (i.e. delivering what has been paid for) from a private sector firm has no comparator/cost with which to compare it. In this way while the Committee may now be presented with improved figures on payroll accuracy, we see no cause for celebration in one basic strand of a contract beginning to meet its targets 3 to 4 years into its operation and only due to consistent rescue from NICS staff. Will this mean that at year 5 or 6 i.e. a third of the way through the contract, the 'old' NICS standard will be reached? We do not believe that anyone would believe that this constitutes 'reform'.
Adverse Impact on Efficiency
5. As previously outlined, the contract's involvement of HR Connect in conducting grievance and disciplinary cases has been a failure. Again, our representatives involved in such personnel cases and, we understand, Departments' retained HR Personnel have found that the "service" is not 'fit for purpose' e.g. HR Connect's minutes of meetings with witnesses continue to have to be rewritten at the insistence of Departmental HR, there is a poor standard of witness statements, recording of interviews, not following due process etc. This has caused numerous difficulties in ensuring that the NICS procedures are followed.
6. It is striking that as late as July 2010, the NICS Corporate HR are engaging in Improvement Workshops at which these same fundamentals of a Personnel 'service' are having to be established (and another 'action plan' generated) due to the fact that NICS Personnel continue to report that employee relations cases are taking longer to conclude than they did prior to HR Connect – particularly in relation to Grievance and Dignity at Work cases.
Deterioration in Industrial Relations Practice
7. As we previously reported the move from an in-house personnel function to a transactional arrangement with the private sector has had negative consequences in terms of industrial relations. The Civil Service industrial relations system was predicated on problem solving by negotiation at the lowest possible level – the 'new' system is built on escalation via lodging of formal grievances on the HR Connect portal. Therein lies both the contradiction and danger of HR Connect in such a context – the need to render its presence and function, however overpriced, indispensible to its client. In addition, the inefficiency of delays as outlined above will inevitably lead to staff (necessarily) invoking their statutory rights as they have no confidence in timely/appropriate redress within the 'new' Personnel system.
8. Another point on industrial relations that needs to be made is that policy should be negotiated, agreed and operational from the point of agreement – not as seems to be the current approach – from the point at which the HR Connect system can "cope" with the outcome of such negotiation. For example, the annual leave allowance is negotiated and agreed as part of a pay deal with the start date for any enhancement stated in a pay agreement. A recent agreement of this kind, however, relating to the 2009 Pay Agreement could not be delivered by HR Connect at the point of agreement between Management and NIPSA. This fails to recognize the fact that an industrial relations timetable should not be shaped by HR Connect's inability to cope/react.
Staff Reaction to HR Connect
9. We previously reported that Staff confidence has been damaged by widespread concern about, inter alia, whether their new HR Connect service will pay them, retain accurate information on them or preserve their right as employees to confidentiality and that these fears are compounded by a system of "Customer Service" system which is wholly inadequate. Given that DFP Officials previously reported to the Committee in February 2009 that "measuring" customer satisfaction is "a key performance indicator", it is clear that the HR Contract has failed.
10. As evidence for this statement, NIPSA would ask the Committee to examine the NICS Staff Attitude Survey of Autumn 2009 carried out by the Human Resource Consultancy Services (HRCS) branch of NISRA. This included questions, inter alia, on Human Resource Services provided by their employer.
11. When asked "Please indicate how much you agree or disagree with the following statement: "Overall, I am satisfied with HR Connect", only 16% of NICS Staff agreed with this statement. This contrasts with figures for satisfaction with Departmental Personnel Branch (61%) and Corporate HR (40%).
12. In addition when asked to agree with the statement "I am confident that HR Connect are knowledgeable enough to answer my queries", the overall figure for the NICS was 15%. Similarly the statement: "HR Connect provide timely responses to queries" only generated agreement from 16% of NICS Staff, while only 17% agreed with the statement - "I am satisfied with the quality of response received in relation to personnel queries". Finally in relation to a statement that "Personnel queries are handled professionally by HR Connect" only 21% of NICS staff believed this to be the case.
Further Staff Reaction - 2009 Millward Brown Ulster (MBU) Research Findings
13. In terms of other research to confirm NIPSA's view, in 2009 Millward Brown Ulster conducted research (using focus groups, in-depth interviews and a telephone survey) that investigated "NICS staff awareness, attitudes and experience of the reform programme to date".
14. The results mirror the hostility towards HR Connect that was expressed in the Staff Attitude Survey. For example the findings revealed:
- Some Departments could not cite any advantages of the HRC System within the group discussions.
- Only 23% had a positive experience of HR Connect (lower than the previous year's figure of 28%). Overall this particular reform caused staff a great deal of stress and frustration. Staff described it as "a disaster."
- There was a general lack of confidence in system.
- The system was described as faceless and "don't really care" in attitude.
- There was also a feeling in many cases that it went live too early, and that this had contributed to many of the "teething problems".
15. In relation to this last finding, NIPSA is aware, however, that the reason the NICS "went early" on some "releases" was due to the fact that the NICS would have incurred costs had they not done so. This is another example of the tail wagging the dog - with the NICS so dependent on its client that the latter dictates the timetable for delivery, even if what is being delivered is inadequate.
16. It is possible that an initial reluctance, from the Management Side, to release this research information was due to embarrassment. For example, within DETI, the desperation to find one 'positive' (as opposed to the 21 negatives reported) on HR Connect unearthed the 'positive' that "Some of the helpdesk staff are "quite pleasant" and respondents said they almost felt 'sorry for them' ".
17. These research findings confirm what NIPSA has been saying about this contract since its inception – it is not 'fit for purpose'. Indeed it is ironic that a memo from the Head of the Civil Service to the new Head of the Shared Service Centre (November 2009), listing a series of issues that need to be addressed, reflected our earlier critique of HR Connect – a critique that Senior Officials from the DFP were treating, at that time, as descriptive of "teething problems".
System Inflexibility
18. NIPSA can offer 3 recent examples of what should be straightforward Personnel responses to events on the ground that demonstrate HR Connect's failure to react either in time, appropriately or at all.
Third Party Access
We have been trying since early 2009 to establish how we would represent our members' interests, at an individual level, in the context of HR Connect carrying out a personnel 'service'. Throughout this process we have witnessed a complete failure from HR Connect, since 2009, to devise a 'system' or way within their processes to facilitate this third party access.
In terms of the timeline on this, it seems incredible that our final negotiations with CHR could be completed in a 10 week period between February and April 2010, conclude in agreement and yet NICS policies can remain stalled and unpublished even after this matter has been brought to the Permanent Secretary's attention. This issue, a relatively straightforward matter, is now scheduled for 'delivery' by March 2011. This appears to be because Corporate HR cannot control its client's timetable for delivery. In our view, this inefficiency is emblematic of the HR Connect 'experiment' in which progress is only possible by devising ways of "working around" the defects of the privatised 'service'.
It is our experience that HR Connect are always on the brink of delivery, with requests for action met with bogus reassurance about them being awarded "higher" and "highest" priority. In reality, nothing happens quickly other than yet another work-around is cobbled together.
ECJ Judgement (Stringer)
In 2009 an ECJ Judgement [Stringer] clarified the rights of employees to accrue annual leave while on long term sick absence. Despite constant reminders from both Trade Union Side and, as we understand it, Corporate HR (CHR), HR Connect has been incapable of adapting their system(s) to cope with such a change. We understand the latest intention, following further intervention from CHR is to come up with an interim solution. Again a modern personnel system that cannot react quickly to a 'change' of this nature is not 'fit for purpose'.
Management Information
It might have been presumed that one of the selling points of an e-HR system would be the swiftness of its ability to retrieve information. This is far from the case. A query we first raised in 2009 – of how long cases were taking broken down by the type of case (Grievance, Discipline etc) has still not been answered despite the NICS "pressing" the contractor (their client) for an answer in March 2010. Similarly when we asked for data on the numbers who were taking partial retirement, we were informed we could get this information but that it was only feasible as a manual exercise given the way information was stored on HR Connect. In response we are informed by Management that "there were problems...in extracting segmented data on employee relation cases" but that a review has been carried out. In other words another gap in what the contractor can provide has been revealed, another NICS rescue plan is draw up. Once again a basic requirement of a modern personnel service, the swift provision of information, can not be delivered, to be followed by the work-around, improvement workshop, plans b, c, d, etc.
Conclusion
19. NIPSA believes that the costly, inefficient, inflexible, cumbersome and unpopular 'reform' that HR Connect represents now requires further scrutiny and a fundamental reappraisal. NICS staff and all other tax payers deserve better than the continued facilitation of this inefficient privatisation.
Advice NI Press Release
News Release 20th October 2010
People on welfare benefits bear brunt of Osborne Spending Review
Advice NI, the independent advice network, warned that cuts contained within the Spending Review would impact most on benefit recipients and low income households.
Advice NI drew attention to the proposals to introduce a one year limit to entitlement to contributory Employment and Support Allowance for those in the work related activity group and the freeze to the basic and 30 hour elements of working tax credit.
Advice NI Chief Executive Bob Stronge said:
"The impact of the cuts imposed under the Spending Review particularly in respect of welfare represent an attack on the poorest families. We are particularly concerned about the proposals to time-limit contributory Employment and Support Allowance. Effectively this represents a fundamental shift and reduction in support for people who are no longer able to work because of long term health conditions. Many people affected by this change will feel that they have paid their tax and National Insurance contributions and yet they will be denied support when they need it most."
Advice NI also drew attention to the raft of other cuts that will affect welfare recipients including the cut to the Support for Mortgage Interest (SMI) scheme; the proposal to limit SMI to 2 years for new Jobseeker's Allowance claimants; proposals to cap Housing Benefit (HB) and reduce HB awards to 90% of the initial award after 12 months for claimants receiving Jobseeker's Allowance; proposals to introduce a more stringent test for Disability Living Allowance claimants; the reduced up rating formula for working out benefit increases each year; and the freeze to child benefit.
Mr Stronge continued:
"We are gravely concerned that Government has viewed the welfare budget as an easy target to cut. We have no doubt that the poorest households are being hit hardest."
"In the current economic crisis many lower income families in Northern Ireland are struggling to pay bills and make ends meet. Advisers are already preparing themselves to cope with increased demands on advice services due to worsening levels of debt; fuel poverty issues over the winter months; people facing redundancy situations and a whole range of other issues at this difficult time. We would urge those in positions of authority and influence to continue to support the work of the advice sector."
Over the last year, Advice NI centres dealt with over 227,000 enquiries across Northern Ireland, the majority of which were social security and debt related. This was in the context of Northern Ireland coping with recession, increased redundancies, mortgage repossession actions and increased numbers of people turning to the social security system.
If you are worried about how Spending Review might affect you, or you would like to speak to an adviser please contact Advice NI for help.
End Notes:
1. Bob Stronge (Chief Executive) can be contacted for further information. Advice NI, 1 Rushfield Avenue, Belfast BT7 3FP
Tel: (028) 9064 5919 or Mob: 07789756954
Advice NI is the umbrella body for the independent advice network in Northern Ireland Advice NI membership currently stands at 70 organisations from across Northern Ireland
2. Advice NI members deal with over 227, 000 enquiries per year, with the majority being social security benefits related
3. If you would like to find out more about the work of independent advice agencies in your area or you would like to obtain copies of the various publications produced by Advice NI, please contact Advice NI, 1 Rushfield Avenue, Belfast; Telephone (028) 90 645919; E-mail info@adviceni.net; Website www.adviceni.net.
NICVA Briefing Paper
Smart Solutions in tough times.
Briefing for members of the Finance and Personnel Committee
1. NICVA, the Northern Ireland Council for Voluntary Action, is a membership and representative umbrella body for the voluntary and community sector in Northern Ireland. Our membership reflects the make up of the sector in terms of both thematic (issue based) and geographical representation. NICVA offers a range of services including advice (governance and charity advice, HR), fundraising, research, policy and lobbying, training and consultancy.
2. In July 2010 NICVA commissioned a paper from Oxford Economics on the likely impact of public expenditure cuts in Northern Ireland. They estimated then that the NI Executive will be expected to make savings of at least £2billion. The outworking of the Spending Review and settlement figure for Northern Ireland confirmed our worst fears.
2.1 As budget holders struggle to meet these demands NICVA is concerned that voluntary and community organisations delivering public services will be vulnerable to unfair and potentially disproportionate cuts. This is because voluntary and community sector providers are often seen as additional to statutory services – even if they have been contracted to provide the core services of a department.
2.2 The reduction in public expenditure could pose a real threat to the capacity and capability of significant parts of the sector. The sector is realistic and is not adopting a begging bowl approach or seeking immunity from the financial pain. It is simply trying to ensure that it is not treated unfairly by accident rather than design.
2.3 NICVA believes that voluntary and community organisations offer a smart solution to the tough economic decisions that lie ahead. In most cases the services delivered by voluntary and community organisations are effective, efficient and provide real value for money. The consequences of unfair and disproportionate cuts are likely to impact on the most vulnerable people in our society. We are calling on government to agree its priorities and the outcomes it wants to achieve for Northern Ireland. And then work with the voluntary and community sector to find smart solutions to the difficult decisions that lie ahead.
3.0 As the programme of cuts rolls out we believe that the large number of budget holders across the system could be tempted to take what they feel may be easier options – cut the external or peripheral, as something that can no longer be afforded. If this turns out to be the case we are concerned that voluntary and community sector organisations will feature disproportionately highly as the easy option. We are asking members Committees of the Northern Ireland Assembly to ensure departments give full consideration to the outcomes they are trying to achieve with the budget it is proposing.
3.1 From NICVA's point of view it is critically important to know the following:
- If a service is to be cut we need to ask how the decision was made. What evidence was considered?
- What are the opportunity costs of the decision? Will it end up costing more in the medium and long term?
- How many people will be affected?
- Do the people likely to be affected come from a vulnerable group or community such as older people, people with a disability, children or a disadvantaged/deprived area? Will they be disproportionately affected?
- Will the service continue to be provided 'in-house'? If so is there a business case to support this as the most effective and efficient method of delivery?
- Has an objective decision been made in order of priority based on outcomes and value for money?
- When it comes to bids for new functions, do the activities planned merit greater priority and are they a more beneficial use of resources than those activities they propose to cut?
4. As the Department for Finance and Personnel has over all responsibility for setting the standard for the effective and efficient use of public money the findings of The NI Audit Officer (NIAO) report into the voluntary and community sector "Creating Effective Partnerships between Government and the voluntary and community sector" will be of interest to Finance and Personnel Committee Members. The report, published in September 2010, found that voluntary and community organisations made a significant contribution to the aims and objectives of government. However when it comes to funding for voluntary and community organisations the NIAO warned that "public sector bodies must be aware of the potential effects of their procurement arrangements on the Sector, and guard against any unintentional and unwelcome alteration to voluntary and community organisations' roles."
4.1 The Audit Office went on to say that "Funders should also ensure, through regular monitoring and reporting, that they adhere to the best practice guidance. In our view there needs to be a greater focus on:
- avoiding unnecessary bureaucracy, in all aspects of the funding mechanism (which can increase costs for both funders and funded bodies) – in applications and renewals; timeliness of payments; and monitoring and audit.
In this respect we will work with the Department and others to establish and promote practical guidance for monitoring and auditing Sector organisations;
- better communication – through improved liaison and contact between public sector funders and voluntary and community sector organisations. In particular, greater clarity about the funders' monitoring and reporting requirements; and greater sharing of information and assessments of organisations between public sector funders; and
- outcomes - the work being done to develop, for example, 'Social Return on Investment' measures should assist in this.
For more information contact Lisa McElherron, Head of Public Affairs, NICVA, 02890 877 777, 0778 5278928, lisa.mcelherron@nicva.org
Advice NI response to White Paper
News Release 11th November 2010
'Universal benefit being paid for by savage cuts to the social security system' warns
Advice NI
Advice NI, the independent advice network, today warned that the Coalition Government's latest welfare reform proposals within their White Paper is being paid for by almost £20 billion cuts to the social security benefit system.
The White Paper sets out plans to overhaul the benefit system and provide greater incentives for work and sanctions for those unwilling to do so.
Speaking about the White Paper, Advice NI Chief Executive Bob Stronge said:
"The proposals are being paid for by extensive cuts to the current benefits system including harsher tests in respect of disability benefits; cuts to mortgage support and housing benefit; and reduced up rating formula for working out benefit increases each year. Benefit claimants survive on the lowest levels of income and advisers are already dealing with people who have seen their benefits reduced and who simply do not know how they will cope."
The White Paper has been put together by Work and Pensions Secretary Iain Duncan Smith and key proposals include a single universal credit which replaces work-related benefits. Claimants moving into work will keep more of their income than now, but face losing benefits if they refuse a job.
Bob Stronge continued:
"We know that there are already stringent conditions for job seeking claimants in terms of being available for and actively seeking work. We would question whether even more draconian measures are necessary, particularly in a climate where there are very few employment opportunities. We also know that many people including the long term unemployed, people with health problems and people with childcare and caring responsibilities face significant barriers to employment will require support to move from welfare to work. There must be a focus on the needs of benefit recipients as they make their journey from welfare to work."
Advice NI has urged anyone who has been affected by recent welfare cuts or who are concerned about how they might be affected to seek help from an Advice NI adviser.
End
Notes:
1. Bob Stronge (Chief Executive) can be contacted for further information. Advice NI, 1 Rushfield Avenue, Belfast BT7 3FP
Tel: (028) 9064 5919 or Mob: 07789756954
2. Or contact Kevin Higgins (Head of Policy) Advice NI, 1 Rushfield Avenue, Belfast BT7 3FP
Tel: (028) 9064 5919 or Mob: 07743496957
3. Advice NI is the umbrella body for the independent advice network in Northern Ireland
4. Membership: Advice NI membership currently stands at 70 organisations from across Northern Ireland
5. Advice NI members deal with over 227, 000 enquiries per year, with the majority being social security benefits related and debt
6. If you would like to find out more visit Website www.adviceni.net.
Colm McCarthy - Centreforum Revised
CentreForum Conference, London, November 12th 2009
Ireland's Second Fiscal Consolidation – Lessons from the Last Time[1]
Colm McCarthy,
School of Economics,
University College Dublin.
colm.mccarthy@ucd.ie
1. Second Time Round for Ireland…….
For the second time in a generation, Ireland is in a deep fiscal crisis, with double-digit borrowing, escalating debt and concerns about the country's solvency in international debt markets, reflected in the second largest adverse bond spreads of any Eurozone member. What's different this time is that the fiscal system's second crisis since the foundation of the state has coincided with the banking system's first. The banks have lost a large portion (on worst estimates, all) of their capital and survive on liquidity furnished, on a prodigious scale, by the European Central Bank.[2]
Parallels with the first Irish fiscal crisis in the 1980s are of limited value given the quite different circumstances. The 1987 to 1990 consolidation did not coincide with a banking collapse, nor did it coincide with a worldwide credit crunch and a rapid world trade contraction. The next section argues that fiscal consolidation post-1987 was less daunting than is likely to be the case over the next few years, and that the role of current expenditure cuts has been exaggerated in journalistic renderings of the history of the period.
The recent deterioration in the Irish public finances has been extraordinarily rapid – even with substantial tax rate increases, revenue has fallen far more rapidly than the tax base, while spending has continued to advance, despite the widespread perception of cutbacks. The conduct of fiscal policy since 2000 is reviewed in section three, and the prospects for a medium-term fiscal consolidation in section four. The paper concludes with some lessons from Irish experience for politicians - and for economists.
2. The 1980s Fiscal Correction and the first Bord Snip[3]
The current fiscal crisis is Ireland's second, and it is understandable that commentators should seek parallels with the first. By 1978, the debt ratio (Exchequer debt to GNP) had reached about 65%[4] and economists had begun warning about sustainability. In January 1980, Taoiseach Charles Haughey made a famous TV broadcast in which he opined that '…we are living beyond our means'. He went on to promise an immediate fiscal austerity programme, but relented quickly. The subsequent development of Exchequer borrowing is shown in the chart.
Chart 1: Exchequer Borrowing as a % of GNP in the 1980s
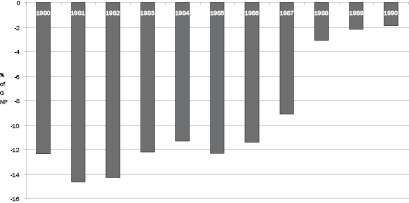
Borrowing ran at double-digit rates for over a decade from the mid seventies, and by 1988, when sustainability was re-attained, the debt/GNP ratio had reached 117%. It is worth remembering that various fiscal programmes were prepared in the early 1980s which envisaged better macro performance than actually occurred and a more rapid return to fiscal balance. What happened in 1988 was planned to happen by 1983 or 1984.
The large deficits from 1980 onwards arose principally from a combination of revenue weakness (despite sharp increases in tax rates), expenditure growth in the early years and the build-up of debt-service costs. There were three general elections in the 1981-82 period, each of which saw a change of government and it is interesting to focus on the position in 1987 compared to 1982 under the main expenditure and revenue headings. This spans the period in office of the only long-lived government (the Fine Gael-Labour coalition took office in December 1982) during the fiscal crisis after the penny dropped, so to speak. The figures are:
Table 1: Fiscal Policy over the 1982-1987 Period.
| Cumulative % Change | Average Annual | |
| Current Services | 40.6 | 7.1 |
| Central Fund | 71.6 | 11.4 |
| Total Current | 47.3 | 8.1 |
| Exchequer Capital | -17.9 | -3.9 |
| Total Govt Spending | 36.5 | 6.4 |
| Total Revenue | 48.7 | 8.3 |
| Nominal GNP | 46.3 | 7.9 |
| CPI | 35.4 | 6.3 |
Source: Department of Finance, Budgetary and Economic Statistics 2009.
Current non-interest spending rose only a little in real terms, but Central Fund (mainly debt service) rose dramatically. Exchequer capital spending actually fell, so total government spending barely exceeded CPI inflation. The lesson is that, if the tax base is growing only very slowly, as evidenced by sluggish nominal GNP[5], the build-up of debt service means that spending must actually be cut – it is not enough to just hold the line. The primary surplus never rises fast enough. The consequence was a fiscal crisis that lasted eight years from Mr. Haughey's dramatic TV broadcast, and a decade from the realization, at least in the economics profession, that this was indeed a fiscal crisis. Debt service absorbed about 30% of tax revenue for ten straight years, total employment in 1991 had barely regained the level of a decade earlier and there was net outward migration in each year bar one from 1980 to 1991. In total, 221,000 emigrated over this period, out of a population averaging about 3.5 million versus 4.5 million at April 2009. All of this was accompanied by external imbalance and successive devaluations within the European pegged exchange rate system of the time. Honohan and Walsh (2002) provide an extended discussion of the attempts to restore fiscal balance during these years.
A minority Fianna Fail government led by Mr. Haughey and with Ray McSharry as Minister for Finance took over in March 1987, and proceeded to establish the first Bord Snip in May 1987. It was led by the secretary of the Department of Finance, Sean Cromien, who has recently penned an account of the episode as viewed from the civil service (Cromien (2009)). A surprising number of myths, none of them the handiwork of the participants, has grown up about the activities and impact of this body, of which the author was a member.
Briefly, there was no significant reduction in the real volume of current spending as a result of Bord Snip 1. There was a further squeeze on capital spending, a mistake in retrospect, but most of the adjustment came on the revenue side. The 'slash and burn' stories about 1987, references to the Finance minister as Mac the Knife, decimation of public services and so forth are just journalistic invention. It never happened and the actual numbers are in the next table.
Table 2: The First Irish Fiscal Correction 1987 to 1990
| 1987 | 1988 | 1989 | 1990 | |
| Gross Current Expenditure | 4.3 | 1.0 | 0.8 | 8.5 |
| Exchequer Capital | -9.2 | -23.7 | -3.0 | 13.1 |
| Total Government Expenditure | 2.7 | -1.3 | 0.5 | 7.0 |
| CPI | 3.1 | 2.1 | 4.1 | 3.3 |
| Gross Exchequer Current Revenue | 8.2 | 7.6 | 1.0 | 8.9 |
| Exchequer Deficit % GNP | -9.1 | -3.1 | -2.2 | -1.9 |
Debt service costs changed little over these years (interest rates had fallen, offsetting the rising debt volume), so the figures for total current spending and for non-interest spending (not shown) are similar. Current spending in real terms rose in 1987, fell a little in 1988, fell a little faster in 1989, but rose quite rapidly in 1990 by which point the real volume of current spending, however measured, was comfortably above the 1987 level. The big contributors to the adjustment were the severe cuts in capital spending and the sharp improvement in revenue. Real GNP through the 1980s developed as follows.
Table 3: Real GNP Growth in the 1980s
| 1980 | 1981 | 1982 | 1983 | 1984 | 1985 | 1986 | 1987 | 1988 | 1989 | 1990 |
| 2.6 | 1.8 | -1.3 | -1.9 | 1.1 | 0.2 | 0.1 | 3.7 | 1.7 | 4.7 | 6.5 |
In 1986, the volume of GNP was about the same as it had been in 1980. It then grew 17.6% to 1990, an annual average real growth rate of 4.1%. A contributory factor was a well-executed devaluation in August 1986. The tax amnesty introduced in the January 1988 budget also contributed, yielding at least 2% of GNP more than expected. It was one of the most successful tax amnesties anywhere at the time, and attracted attention from policymakers internationally (Uchitelle (1989)).
The first Bord Snip contributed no doubt, but more in the sense of the old football adage that '….you make your own luck', in other words, you get yourself into a position to get lucky. The capital cuts, in retrospect, were overdone during the 1980s, tax rates were raised to self-defeating levels and the emerging fiscal crisis could, and should, have been addressed much earlier. If it had been acknowledged in say 1978 and dealt with decisively, it could have been over by about 1982 or 1983.
By the end of the 1980s, the public did not need persuading that there was indeed a fiscal crisis: the topic had dominated political debate for a decade. The current position is decidedly less favourable in that regard: the deterioration has been sudden, and has coincided both with a domestically-generated banking collapse and a deep international recession. Public acceptance of the need for severe spending adjustments has been weakened by a decidedly populist public spending competition through the bubble period between government and opposition, which lingers in the form of escapist proposals to somehow avoid fiscal adjustment. A further difference from 1987 is the markedly less forgiving condition of the international sovereign debt markets, in which Ireland was one of the few heavy borrowers at times during the 1980s.
On the plus side, the extraordinary pace of spending increases in the last decade means that Bord Snip 2 has been operating in what the US Air Force would describe as a target-rich environment, which was not the case in 1987.
3. Fiscal Policy since 2000
From a position of fiscal balance and a declining debt ratio that had lasted over a decade, the public finance position has this year lurched into heavy deficit, and the debt ratio has begun to rise rapidly. On the GGB definition, gross debt will have more than doubled as % GDP in just two years by end 2009. The table shows developments in some public finance aggregates since the turn of the century.
Table 4: Trends in Spending, Deficit and Debt, 2000 to 2009.
| 2000 | 2001 | 2002 | 2003 | 2004 | 2005 | 2006 | 2007 | 2008 | 2009f | |
| Tot Spend % Chg* | 10.4 | 16.1 | 11.0 | 7.7 | 6.2 | 11.1 | 10.6 | 11.5 | 9.8 | 7.1 |
| Current - CF % Chg | 11.4 | 19.7 | 14.8 | 9.2 | 7.7 | 10.3 | 10.6 | 12.1 | 9.9 | 6.0 |
| CPI % Chg | 5.6 | 4.9 | 4.6 | 3.5 | 2.2 | 2.5 | 4.0 | 4.9 | 4.1 | -4.4 |
| Total as % GNP | 34.7 | 36.7 | 37.5 | 36.6 | 36.2 | 37.0 | 36.8 | 38.8 | 44.5 | 51.1 |
| GGB Deficit** | 4.7 | 0.9 | -0.4 | 0.4 | 1.4 | 1.7 | 3.0 | 0.2 | -7.3 | -12.0 |
| GGB Debt** | 37.8 | 35.6 | 32.2 | 31.0 | 29.4 | 27.5 | 25.0 | 25.1 | 44.2 | 59.0 |
*Total = gross current + Exchequer capital + Central Fund (CF).
** Both as % GDP
The recent sharp deterioration in both deficit and debt ratios is of course driven in part by the unprecedented decline in GDP. On any measure, spending grew rapidly from 2000 onwards, the more so when some of the measured output growth was borrowed from the future so to speak, through building a large unsold stock of houses, retail and office space, which will overhang the market for years. Government spending relative to GNP was growing up to 2007, and even more so if the GNP growth rates and hence tax buoyancy from say 2002 onwards were in truth not as good as they looked. The dramatic increase in spending ratios in the last couple of years has a large cyclical component, but it is salutary to note that the real increase in current spending in 2009, even excluding debt service, will likely be in double digits.
This continuing expenditure growth has of course been accompanied by an unprecedented collapse in tax revenue. This has exceeded by a large margin the decline in the tax base, reflecting the excessive reliance on taxing transactions in assets. Receipts from stamp duty, VAT on new house sales and CGT on non-residential property fell by 4 full GNP points from 2006 to 2009.
Chart 2: Exchequer Spending, excl Debt Service, as % GNP, since 1983
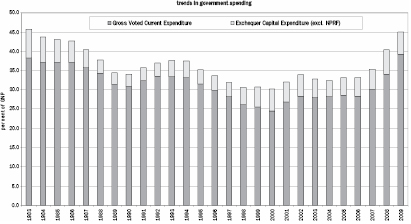
The recent economic history of Ireland can be divided provisionally into the fiscal consolidation phase up to the currency crisis of late 1992 and early1993; the Celtic Tiger period which lasted until about 2001; followed by the Bubble, which began to burst in mid-2007. The Irish Bubble has been, in relative terms, one of the largest in a developed country and seems destined to spawn a cottage industry for economic analysts to rival that created by the Tiger. The main domestic components were failures in expenditure control and in the regulation and supervision of the banking system. Of course even if Irish policy had been flawless in both of these dimensions, the economy would now be experiencing a serious downturn, but it is a form of denial, and not conducive to the best policy response, to pretend that the current crisis was caused by an asteroid strike, or the unfortunate Brothers Lehman. Ireland has had a pretty spectacular public spending bubble, concealed from view by the transient tax revenues generated by a credit-fuelled property bubble. Spending grew dramatically, but the public finances stayed in balance until 2007. The rocketing deficit in 2008 and 2009 reflects the simultaneous bursting of the double-Bubble, coinciding of course with the international downturn and some more local difficulties, including sterling weakness: the United Kingdom remains a key market for Irish exports, and Ireland has more non-Euro trade than any other Eurozone member.
4. Fiscal Consolidation over the Medium Term
The recent revised programme for government reiterates the commitment to the fiscal consolidation targets outlined at the time of the supplementary budget last April. These are
Table 5: Government's Fiscal Consolidation Programme
| 2009 | 2010 | 2011 | 2012 | 2013 | |
| GGB Deficit % GDP | 12.00 | 10.75 | 8.50 | 5.50 | 3.00 |
| GGB Debt % GDP | 59 | 73 | 78 | 79 | 77 |
| Assumed GDP Growth | -7.7 | -2.9 | +2.7 | +4.2 | +4.0 |
In April, the GGB deficit for this year was expected to be 10.75% of GDP. Due mainly to tax revenue weakness, this now looks unlikely, and 12% is more realistic. The GGB debt, shown at 59% in the April document, will presumably be several points higher, as would the figures for subsequent years. The GDP decline shown for 2010 is pessimistic compared to more recent forecasts, but the numbers pencilled in for 2011, 2012 and 2013 are ones a lot of people would settle for. The adjustment, crucially, is expected to come substantially on the revenue side. Tax revenue is assumed to rise 27% from a 2009 base now unlikely to be reached. The figures also assume that spending grows very little, despite the inevitable build-up of debt service costs, implying significant real cuts in the non-interest component. These are forecasts, and debating their plausibility is pointless. What matters is the target deficit for 2013, at the SGP limit of 3%. The Stability and Growth Pact has been relaxed but not abandoned, and Eurozone members are still expected, when the dust settles, to (i) not breach the 3% limit, but also to (ii) adhere to the 0% average over the cycle.
The revised government programme agreed between Fianna Fail and their Green coalition partners early in October states, regarding the re-affirmation of the fiscal consolidation programme,
'This plan has been welcomed by the European Commission'.
No doubt it has, but more importantly it has been permitted by the European Commission, and as a concession – no other member state, so far as I am aware, has been given until 2013 to get back to 3% borrowing. Thus those, such as the Irish Congress of Trade Unions, who argue for a much longer period of adjustment are in effect arguing that Ireland should go back to the Commission and re-negotiate the terms of its adherence to Eurozone rules. There can be no presumption that such a re-negotiation would succeed.
Nor is it self-evidently in Ireland's interests to spin out the adjustment to 2017 or 2018, were it to be permitted by the Commission, and by the international sovereign lenders. The exit debt ratio could easily exceed 100% of GDP at the end of a decade-long adjustment.[6] An important difference between the current situation and the 1980s is that worldwide sovereign debt issuance is at unprecedented levels and the markets, though improving, remain stretched. As quantitative easing programmes are withdrawn, the bond issuance which they have been supporting will also have to be trimmed, so the European Central Bank's stance will affect Ireland's options. Finally Ireland's credit spread at ten years against the bund has recently been around 150 basis points, the largest adverse spread of any Eurozone member. Bluntly, this means that the markets are not convinced that Irish debt is free of risk, and countries with higher debt ratios than Ireland, and no greater liquidity, enjoy narrower spreads. Any move to delay the fiscal adjustment could see spreads widen further, adding quickly to debt-service costs and thus offsetting at least in part the intended relaxation of fiscal policy. Some of those advocating stimulus or a slower adjustment are assuming an elastic supply of sovereign credit at unchanged cost, as well as low fiscal leakages, neither of which is self-evidently realistic.
Fiscal consolidation must be seen in the broader policy context. In addition to fixing the budget, Ireland needs to fix the banking system, cut wage and non-wage costs to restore competitiveness and de-leverage the national balance sheet. In a recent address to a conference in Dublin , the Central Bank Governor suggested that a reasonable medium-term target would be to re-balance the economy with revenue and expenditure shares in GNP around the levels prevailing eight or ten years ago (Honohan (2009b)). This would mean a sharp increase in the ratio of tax revenue to GNP from current very depressed levels. Rates of tax have already been increased and there may be further increases on the way, but the tax/GNP ratio should rise anyway without rate increases. People will have to replace cars eventually, for example, and the rise in the savings ratio, which has been depressing VAT and excise yields, cannot go on forever.
But the Governor's suggestion also implies that the recent sharp increase in the ratio of public spending to GNP should be reversed. Some of it is cyclical and will reverse anyway as the economy recovers, but it must be accepted that some of the increases during the Bubble were based on a misperception of the economy's long-run taxpaying capacity. What must be avoided is any nostalgia, in any area of policy, for the unbalanced economy which emerged in the final years of the Bubble. In 2007, Ireland had full employment, easy credit and a balanced budget, but also had iffy banks, excess leverage throughout the system, crowding-out of the traded sector and poor competitiveness. It felt fine, but it was not a good place to be.
A re-balanced economy will not look like 2007, unless Ireland somehow manages to persuade foreigners to finance another Bubble. At its simplest, it will need to switch resources from making buildings and other non-tradables to making exports. It is clear from the table that the shrinking of the construction sector continues apace, with employment
The 1987-90 fiscal consolidation finally took place in a more propitious environment than seems likely over the next four or five years: GNP growth rates will do well to average 4%, the sovereign debt markets are more crowded and less forgiving, and Ireland cannot have another last-chance tax amnesty. Nor of course can it have a currency depreciation. But the years preceding the 1987 corrective action were ones in which current and capital spending had grown very little – this time, the fiscal correction succeeds a bubble in public spending as well as in credit expansion, and the scope for expenditure cuts is substantial.[7] The spending cuts proposed to government must be substantial given the circumstances, and reflect the distribution of current spending. In a modern welfare state, spending control means control of pay and control of social transfers.
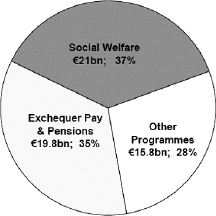
Chart 3: Distribution of Current Exchequer Spending in Ireland, 2009.
5. Lessons from the 1980s for Politicians (and Economists)
- The principal lesson for policymakers is that little was achieved by delaying the first Irish fiscal adjustment. Had action been taken from as late as 1980, and it would have been justified even earlier, the economy could have skipped five miserable years.
- A medium-term consolidation is more likely to under-achieve, the rosier the macro projection on which it is based. Better be cautious, and be surprised on the upside!
- Even with rising tax rates, it is difficult to realise substantial increases in tax/GNP ratios in a downturn.
- With debt-service building up, and pressure on social transfers, actual cuts are needed for stabilisation – it is not enough just to halt the rise in real non-interest spending.
There are some lessons for economists too. While the full dimensions of the current Irish implosion were foreseen by no-one, it is simply untrue that no warnings were issued about the emerging banking and fiscal crises: whether they were loud enough is another matter, although what is heard matters more than what is said. The IMF reports on Ireland from the early years of the current decade make interesting reading, especially on banking and credit developments. On the lack of discipline in expenditure control see Lawlor and McCarthy (2003). But it seems obvious that, after the abolition of the currency in 1999, many Irish economists began to focus more on micro-policy concerns, believing that the big macro issues including external financial balance and budgetary policy (given the Stability and Growth Pact rules) had been taken off the list of things likely to go wrong. This was a bad call!
The legendary hurler Christy Ring was noted for taking advantage of the inattention of Cork's opponents when the referee held the ball after stoppages in play. He was accused of gamesmanship, taking quick frees, even of swapping a soggy ball on a wet day for a crisp dry one secreted on his person. Asked about this after he retired, Ring remarked:
'Always keep your eye on the ball, especially when it's out of play'.
Appendix: Choice of Denominator for Fiscal Ratios
It is conventional internationally to express fiscal ratios (tax or total government revenue, current or total expenditure, various debt and deficit measures) as a percentage of GDP, a geographical output concept. Thus GDP answers the question 'how much output is produced annually in China?', not how much of it accrues to Chinese economic agents, or is available for disposition by the Chinese authorities. The EU's Stability and Growth Pact explicitly employs GDP as the denominator for debt and deficit ratios, and organisations such as the IMF and OECD routinely make international comparisons, and do fiscal policy analysis, with GDP as the denominator.
The alternatives are GNP, GNI (gross national income), or GNDI (gross national disposable income). They are related as follows:
GDP plus/minus factor payments abroad = GNP
GNP plus/minus other current payments abroad (eg EU taxes/subsidies) = GNI;
GNI plus/minus other international transfers (foreign aid, emigrants' remittances, net EU transfers) = GNDI.
There are many countries where the differences between these aggregates are minor. A country with a small net creditor/debtor position, small foreign sector, will have GDP roughly = GNP roughly = GNI, and if it is not a big aid giver or receiver, and has small migrants' remittances, GNDI will be similar too.
Ireland is not such a country. Factor payments abroad are substantial and both emigrants' remittances and outward aid flows have been rising recently. So income is less than output and the choice of denominator matters.
Some figures for the ratio of GNI to GDP for European countries are shown in the table. The Euro-area average is 99.3%. Most countries are in a range of a few points either side of 100, with just four out of twenty below 96. Just two, Luxembourg and Ireland, are below 90. In both cases, there are substantial annual net outflows in the form of factor payments, mainly returns on foreign capital. At least for comparative purposes across European countries, it matters which denominator is chosen in Ireland.
Table 7: Ratios of Gross National Income to Gross Domestic Product, 2008.
| Austria | 98.4 | Hungary | 93.3 | Slovenia | 97.7 |
| Belgium | 100.4 | Ireland | 85.8 | Spain | 97.3 |
| Czech Rep | 92.5 | Italy | 98.5 | Sweden | 102.2 |
| Denmark | 101.8 | Luxembourg | 75.5 | United Kingdom | 102.1 |
| Finland | 99.8 | Netherlands | 97.4 | ||
| France | 100.7 | Poland (2007) | 96.4 | Euro Area | 99.3 |
| Germany | 101.7 | Portugal | 96.0 | ||
| Greece | 96.7 | Slovakia | 97.5 | Source: OECD. |
It also matters when looking at long time-series, since the relationship between the competing denominators has been shifting. Up to the mid-1970s, GNP and GDP were roughly equal, for example, and GNP was about 90% of GDP through the late 1980s and up to the mid-1990s. It has recently fluctuated about 85%. Recent trends in the income measures, as a % of GDP, are shown in the next table.
Table 8: Alternative Income Measures as % of GDP, Ireland.
| 1995 | 2000 | 2001 | 2002 | 2003 | 2004 | 2005 | 2006 | 2007 | 2008 | |
| GNP | 88.4 | 85.2 | 83.8 | 81.8 | 84.5 | 84.7 | 84.6 | 86.3 | 85.0 | 85.0 |
| GNI | 90.2 | 86.2 | 84.5 | 83.0 | 85.5 | 85.6 | 85.8 | 87.0 | 85.6 | 85.8 |
| GNDI | 91.1 | 86.1 | 83.9 | 82.4 | 84.8 | 84.9 | 84.8 | 86.0 | 84.5 | 84.4 |
All three ratios fell sharply from 1995 to 2000, oscillated to 2006 and have slipped again in the last couple of years.
In the context of assessing fiscal policy, and in particular of the credibility of fiscal consolidation programmes, the critical issue is taxable capacity. The best denominator for fiscal ratios, in this view, is the one closest to the tax base. Interestingly, member states pay contributions to the EU budget based on GNI, although the EU uses the output measure GDP for fiscal ratios under the Stability and Growth Pact. Thus when it comes to levying the EU's 'tax' on members, GDP is abandoned. In supporting a contention that Irish public spending has been low compared to European averages, Karl Whelan (2009) favours GDP as the fiscal denominator. Noting that not everyone agrees, he states (in footnote 8):
'Another argument is that GNP rather than GDP should be used for such comparisons. I disagree with these arguments because all income produced in Ireland is eligible for taxation by the Irish government.'
Output produced in Ireland does not translate into income available to Irish taxable entities though. A portion of GDP (corporate profits much of which are ultimately expatriated) are nominally subject to tax at 12.5% (it is not clear that all are actually taxed at this rate), but most tax revenue comes from income, payroll and expenditure taxes. These are probably best proxied by GNDI. If a choice has to be made between GNP and GDP, GNP is far closer to GNDI. Whelan's point that '….all income produced in Ireland is eligible for taxation by the Irish government' is true but not operationally significant: the excess of GDP over GNP is taxed only a little, and it is not clear that an increase in the rate of tax (on currently expatriated corporate profits) would yield extra revenue. Of course, the best way to do taxable-capacity analysis is through a fully articulated model of tax revenues, and the Irish models embed a detailed revenue specification. Fiscal ratios are shorthand at best.
References:
Cromien, Sean (2009): An Cead Bord Snip, Contemporary Irish History Seminar, Trinity College Dublin, March 4th. 2009, mimeo.
Honohan, Patrick (2009b): Resolving Ireland's Banking Crisis, Economic and Social Review Vol 40 No 2, pgs 207-232.
Honohan, Patrick (2009b): Address to ESRI/Foundation for Fiscal Studies Conference, Dublin, 13th. October 2009, on www.centralbank.ie.
Honohan, Patrick and Brendan Walsh (2002): Catching up with the Leaders: The Irish Hare, Brookings Papers on Economic Activity 1:2002, pgs 1-77.
Lawlor, John and Colm McCarthy (2003): Browsing Onwards: Irish Public Spending in Perspective, Irish Banking Review, Autumn 2003, pgs 2-17.
Uchitelle, Elliot (1989): The Effectiveness of Tax Amnesty Programmes in Selected Countries, Federal Reserve Board of New York Quarterly Review, Autumn 1989.
Whelan, Karl (2009): Policy Lessons from Ireland's Latest Depression, paper to MacGill Summer School, July 20th. 2009, mimeo.
[1] An earlier version was read to the conference of the Dublin Economics Workshop, Kenmare, Co. Kerry, October 18th. 2009. The author would like to thank conference participants for comments, Marie Hyland for research assistance and FBD Trust for financial support.
[2] An account of the Irish banking collapse can be found in Honohan (2009a).
[3] Irish State agencies are often called 'An Bord Xxxx', meaning the Electricity Board or the Gas Board. In both the 1980s and the current crisis, the public spending reviews have been dubbed An Bord Snip by the media. Officials tend to give committees titles like 'The Special Group on Public Service Numbers and Expenditure Programmes', the official title for the current review, so the media can perhaps be excused.
[4] This is a backward extrapolation on the revised basis adopted from 1982 onwards.
[5] GDP and GNP are little different in most European countries, but GDP is considerably bigger in Ireland. There are reasons to prefer GNP to GDP for fiscal ratios – see appendix.
[6] The net debt has recently been about 20 GDP points below the gross figure (the state has financial assets, mainly cash arising from pre-funding by the debt management office and the securities held by the National Pension Reserve Fund). But the gross debt figure contains no provision for any Exchequer costs which might emerge from the bank rescue, which works the other way.
[7] The reports of the recent spending review are downloadable at www.finance.gov.ie
Colm McCarthy presentation
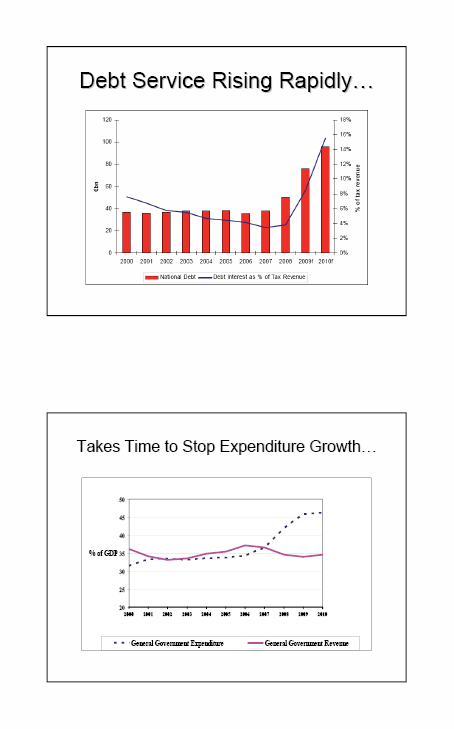
M McLaughlin - Budget and CSR
Shane,
I have been going through material related to the Budget/CSR. I was comparing the DEL spending limits from the Budget and in the CSR to see if there are any discrepancies. The tables I'm referring to are Tables A5 & A6 of the CSR (p.81 & 82) and the comparable table in the Budget Redbook Table 2.2 (p.43).
There are a number of discrepancies and the totals for Resource DEL in 2010/11 fall from £342.7bn to £326.6bn (A5 and 2.2). However, in the Budget (2.2) the total for the NIE and NIO combined is £9.8bn, whereas in the CSR it is £9.3bn. This is even while it's claimed that cuts have been deferred by 1yr to 2011/12 (note 9 to A5). The capital budget is unchanged at £1.2bn.
In fact total DEL spending falls to £378.2bn in the current FY (CSR Table A9, p.85 versus 2.2- before depreciation is accounted for) down from £394.3bn at the time of the Budget (2.2), a fall of £14.1bn this year, not £6.2bn. In addition, within that lower spending total £4.1bn is set aside for 'reserves' and now an entirely new category of spending created 'special reserves' which together comprise £8.2bn this year (Table A9). Initially, this was just £1.5bn this year (Table 2.2).
Can the committee consider this matter and perhaps seek some explanation?
Mitchel
Mike Smyth's Notes
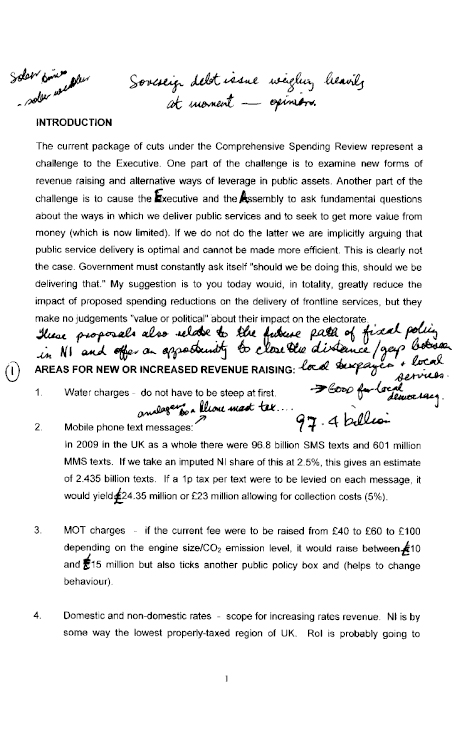
Professor Alan Barrett - Achieving Budgetary Savings
Achieving Budgetary Savings
A Note for the Committee for Finance and Personnel, Northern Ireland Assembly
Prepared by Professor Alan Barrett, Economic and Social Research Institute, Dublin
19 November 2010
Introduction
Since early/mid 2008, it has been clear that a serious imbalance existed in the public finances of the Republic of Ireland and that a programme was needed to restore the public finances to a sustainable trajectory. Over this period, when writing our Quarterly Economic Commentaries at the Economic and Social Research Institute, we have made some recommendations on how savings could be made and revenues increased in ways that satisfied certain desirable criteria. In this brief note, I will outline the sorts of principles which we have set out and the sorts of recommendations that then emerged. I should stress that no single research project was conducted in which we took a comprehensive overview of what measures should form part of a fiscal consolidation. As a result, our recommendations were focussed on particular issues and this note should be read and understood in that context.
Taxation
In considering tax increases, our analysis has been influenced by the report of the Commission on Taxation (2009). Two core principles when designing taxes are equity and efficiency. Loosely, equity requires that people in similar positions pay similar amounts of tax and that better off people should pay relatively more of their income in tax. Efficiency requires that the tax be as non-distortionary as possible, meaning that impacts on economic activity should be minimised.
We have made a number of recommendations on how revenues can be increased, based in part on these principles. As the Republic of Ireland does not have a residential property tax (on the primary residence) we have argued for many years that such a tax be introduced. Such taxes are generally considered to be less distortionary than others and so satisfy the efficiency criteria. By way of incorporating equity considerations, it has also been proposed that the tax is only levied on households which exceed a certain income threshold.
Efficiency considerations have also led us to recommend the ending, or scaling back, of some tax reliefs. Tax reliefs are often introduced with a view to generating economic outcomes such as increased saving for pensions or urban regeneration. In some cases, a question can be raised as to whether the original objective is still valid. In the case of property-related reliefs in the Republic, the answer is often clear. In the case of other reliefs, a question can be raised over whether the existing level of generosity of the relief is needed to ensure that the objective is realised. In the case of pension reliefs in the Republic, some have argued that it is not entirely necessary to allow write-offs at the marginal rate (41 percent for higher earners) and that the write-off should be given at the standard rate (20 percent).
Environmental taxes have been studied at length in the ESRI and this is an area where two objectives (revenue raising and environmental sustainability) can be achieved through one policy instrument. Since the 1990s, the ESRI has advocated a general carbon tax to be levied across fuel types. One argument against such a tax is the negative distributional consequences – these arise because poorer households pay a higher proportion of their incomes on fuel. In order to overcome this, proposals to levy such a tax were typically augmented by proposals to recycle some of the revenue to lower income households through, for example, the benefit system.
More finely targeted environmental taxes have also be proposed by the ESRI, and implemented. One example is the differentiated rate of car tax, where higher rates of tax are applied to heavier emitting cars.
User charges
The imposition of user charges for a variety of services provided by, or on behalf of, public bodies has many desirable features. Apart from the obvious advantage of providing a revenue stream, such charges can also result in more efficient uses of services – one example is the greater likelihood of water conservation in the presence of volume-related water charges.
Among the user-charges that the ESRI have recommended are water charges, road tolls and university fees. Among these, university fees are perhaps the most controversial given that discussions of university education are often based on a premise that such education is a public good and so should be provided free. We have generally taken the view that the main beneficiaries of third level education are the graduates themselves and so it is preferable that some mechanism be in place to charge, possibly through a student loan/graduate tax approach.
On road tolls, the argument was regularly advanced that the users of roads should be asked to pay for them. In applying such tolls, there has been a concern that overly high charges could discourage use, thereby reducing the value of the initial investment. Such considerations have led to tolls being reduced for the Dublin Port Tunnel.
Given the economic environment, we are seeing an extension of charges and increases in existing charges. One recently introduced charge is a prescription charge, through which holders of medical cards must pay a modest fee for each prescription filled (even though the prescribed medicines are still free). The objective of these fees were not so much about raising revenue as curtailing demand in the free drugs scheme. In this way, the major impact of the prescription charge is expected to be through savings in drugs payments as opposed to the revenue that is raised through the charge.
The Public Sector Pay Bill
As the depth of Ireland's public finance difficulties became apparent during 2008, the ESRI began to consider the question of whether or not there was scope for reducing public service salaries. Although this may have sounded somewhat heretical, our thinking was motivated in part by a belief that public services could best be protected during the downturn through retaining employees and reducing costs through pay rates. One way of assessing whether there was scope to reduce public sector pay rates was to examine how the pay of public servants compared to that of private sector employees, taking into account other factors that influenced wages such as age, experience, education and gender.
The research conducted by the ESRI showed that there was indeed a pay premium for working in the public sector. Based on data from 2006, the premium was estimated at 20 percent. In many ways this was unsurprising, given the "benchmarking" exercise of the early 2000s when significant increases had been given to public sector employees. While it is always difficult to establish that research outcomes led to policy actions, we would have a suspicion that the analysis conducted by the ESRI made the imposition of public sector pay cuts more acceptable than they otherwise would have been.
It is probably worth noting at this point that although public sector pay has been reduced in Ireland, through a standard pay cut and through the imposition of a "pension levy", the pensions of former public sector employees have not been cut. This is the case even though this group of pensioners benefitted from the benchmarking exercise as their pensions were related to the salaries of existing public sector employees. The ESRI has pointed out that this is an anomaly which is difficult to justify.
Social Welfare
The economic situation also generated inevitable social welfare reductions and so the issue arose of how best to achieve such reductions. Our take on this was to begin by questioning the desirability of maintaining universal benefits in the context of the downturn. One of the bigger programmes within the Republic's social welfare budget is "child benefit". Under this programme, payments are made to all mothers, regardless of income or wealth, with the payments per child having been in the region of €125 per month. In our Autumn Commentary of 2009, we proposed cutting this by 25% on the grounds that payments were being made to people who didn't need support. We also suggested that offsetting measures be taken through the welfare system.
Many other universal benefits in the Republic are given to those aged over 65 – for example, free bus and rail travel, free TV licences etc. As a general principle, we would see these universal payments as being unaffordable and that efforts to maintain them only result in lower levels of support to those who genuinely need them.
Cutting the non-universal elements in the social welfare budget are more controversial. The government did cut most benefits (old-age pensions were the exception) by about 5 percent in Budget 2010 but this was against a background of price falls (CPI inflation was minus 4.5 percent in 2009). Further "across-the-board" cuts may be applied in Budget 2011 and this may well be needed. However, we would be of the view that there may be grounds for reducing spending through tighter eligibility before broad cuts are introduced. Looking ahead, this approach will be implemented when the age at which old-age pensions are paid are increased (to 66 in 2014 and to 67 in 2022).
General Government Programmes
Whether times are good or bad economically, Government's should continuously review programmes to see if the objectives are still valid or to see if the programme is still being run in a cost-effective and efficient manner. In the case of capital programmes, rigorous cost-benefit analyses should always be conducted.
One area of government spending where the ESRI has undertaken reviews is with respect to state-provided training. Though following programme participants and non-participants over time, it is possible to generate reasonably sophisticated estimates of the impact of training on subsequent labour market outcomes. Much of the ESRI research on this has been able to shine a light on what forms of programmes do generate positive results and which don't. Such research has then been used to re-structure programmes.
Another piece of ESRI research that has led to a change in the delivery of a public service is again in the area of active labour market programmes. Up until recently, the Department of Social Protection ran a system whereby all people who had been on the Live Register for a period of time were referred to the public employment service (PES). At this point, they were interviewed with a view to putting in place a series of interventions which were aimed at assisting the person to re-enter employment. This is a good idea in principle. However, drawing on the lessons from other countries, the ESRI suggested that the system could be improved if those most at risk of becoming long-term unemployed were referred to the PES at the time that the first sign on. By using a statistical model which relates an individual's characteristics to their probability of becoming long-term unemployed, it is possible to target this early intervention on those who need it most. The process is named "profiling" and is now being piloted by the Department of Social Protection.
Dr Graham Brownlow
Efficiency and Equity over the Longer-Run: A Briefing Paper for the Committee for Finance and Personnel
Dr Graham Brownlow
Queen's University Management School
Summary
1. In this briefing longer-term issues germane to equity and efficiency are to the fore as others have adequately set out the immediate budgetary situation.
2. The economic underperformance (and the consequent poor public finance position) of Northern Ireland has been a long-term phenomenon. Organizational reform and a commitment to efficiency over the long-term need to be recognized as vital components in restructuring the financial position.
3. Moving towards an enterprise zone requires a menu of policies. The best evidence from the academic literature (as well as the evidence that has informed Scottish policymakers) suggests that a cut in Corporation Tax at a regional level, while it may have economic benefits, it is not the economic panacea that some business lobbyists and journalists have claimed.
4. The prudent use of tax-varying powers is however a potentially fruitful way to rethink how efficiency and equity can be reconciled in the Northern Irish economy. The introduction of water charges and mobile text taxes may provide the modest starting point required.
5. Economic efficiency- like equity- must not only be pursued but it must be seen clearly to have been pursued. In practice this means providing greater transparency on the techniques and frameworks used by officials in performing economic evaluations.
6. Given the need to raise economic efficiency in both Northern Ireland's public and private sectors attention must be paid however, to the balance of time paid to performing evaluations relative to longer-term policy formulation. Likewise, evidence-based policy should be to the fore. Hence the lack of formal organizational machinery between the two universities and economic-policy-makers is regrettable as it detrimental to the pursuit of efficiency and equity.
7. The loss of jobs in the current recession implies a need for retraining of some workers laid off. Such needs are particularly relevant to those laid off from the construction industry.
8. James Heckman, Nobel laureate in economics, has noted that economically childhood disadvantage can last a lifetime. He suggests that redirecting the American educational budget towards children from disadvantaged environments tends to increase the productivity of such children. In short, focusing education budgets on the very young will over the longer-term reduce inequalities and raise prosperity. The equity and efficiency implications of this analysis for Northern Ireland are particularly salient.
9. The equity and efficiency implications of public sector pay settlements in Northern Ireland, especially at the upper end of the pay scale, may be worth revisiting over the longer-term.
1. Introduction
Most experts and commentators who have written on the implications of the UK Government Spending Review have considered the immediate issue of revenueraising and cost-cutting. This focus is understandable, but as a piece of economic analysis it is far from the whole story. In section 2 some findings on public sector efficiency are laid out. Evidence on the economics of training is presented in section 3. This topic is particularly germane to Northern Ireland, given the adjustments that need to be made in the labour market. Section 4 considers some salient work on the appropriateness of national pay bargaining.
For the record it is very hard to argue with the vast bulk of the analysis developed in 2009's Independent Review of Economic Policy (IREP) (IREP, 2009). IREP found that Northern Ireland's economic fortunes require supply-side improvement in innovation and productivity. In turn, IREP demonstrated that making such a step improvement in productivity and innovation will require a greater policy focus on R&D. IREP was correct as a piece of economic logic in placing its emphasis on the need for much greater regional self-reliance within local industry with an emphasis on innovation (PWC, 2010a, p.9). IREP is a vital analytical starting point for this committee because only greater private sector efficiency can create the conditions under which output and employment will grow. Such growth is necessary if the long-run public finance situation is to improve.
Likewise, as Dr Birnie has argued elsewhere, I would suggest that the evidence presented to Calman Commission and Varney indicates that a Corporation Tax cut in isolation is not the 'game changer' that some have claimed (PWC, 2010b, p.32). Likewise, I also agree that deferment of water charges is a policy that makes little economic sense (PWC, 2010b, p.33). The proposal for a tax on mobile phone text messaging would likewise be beneficial to the region's public finances as well as providing a modest test-bed from which to develop more ambitious tax variation powers.
Economic theory and history, as opposed to journalistic scribbling, demonstrates that efficiency-enhancing measures may be slow burners and multicausal. Low corporation tax in the Irish Republic was notably only part of a wider menu of policies rather than acting in isolation. The Independent Expert Group to the Commission on Scottish Devolution (IEG) noted that in a regional context the impact on real economic activity depends on the inflow of firms into a region relative to the incentive to merely "shift" profits (as well as the compliance costs of such a change).
The IEG concluded that while corporation tax reductions for a region would not necessarily produce harmful tax competition, it also found that the profit "shifting" and compliance costs were significant. The IEG analysis in turn followed on from Varney's (2007) rejection of corporation tax as a 'game changer'. In short, low corporation tax in isolation will not transform the economy and public finances. The idea of turning Northern Ireland into an 'enterprise zone' should not be equated with the attainment of low corporation taxes.
While the emphasis some have placed on public sector cuts, revenue raising and tax variation is understandable, these issues are not what I will focus on in the remainder of this document. In my evidence I want to focus instead on what the academic evidence actually suggests will raise efficiency over the longer-run as well as focusing on the need to restructure the way policies are implemented. As Dr Birnie has noted elsewhere, implementation rather than analysis has been the major longterm shortcoming in terms of economic policymaking within Northern Ireland (PWC, 2010b, p.17). Accordingly this document will focus on the evidence surrounding policies and the relevant implementation issues.
In short, the best evidence indicates that incentives matter in the private and public sector. Accordingly, I want to note how economic advice is developed is far from transparent and that greater transparency would make it much easier to judge the efficiency implications of policy decisions. Furthermore, trade-offs are inherent in attempts to raise efficiency: not every policy proposal will have the same payoff profile. Some policies will immediately yield efficiency payoffs, while others take will longer. A complication arises from (among other things) the fact that the longer payback policy may yield greater overall benefits than the shorter-term payback. Likewise, the existence of trade-offs between efficiency and equity provides a further complexity.
Despite these complexities economic research does provide some guides. Alas there is not nearly enough contemporary academic research on the Northern Irish economy, so evidence from other relevant cases are used in this document and then the implications for Northern Ireland are drawn out below.
2. Public Sector Efficiency
The CBI and the NICC have both argued that improving public sector efficiency will be vital part of improving the future output, employment and productivity growth trajectories of the region: this analysis is borne out by academic research on other regional economies. Academic evidence equally indicates that organizational reform in the public sector must play its part in making the public sector more efficient. Below it will be argued that evaluation and competition are key organizational insights that are of relevance to improving the implementation of policy in Northern Ireland. Likewise, the absence of formal links between the universities and economic policy-making bodies has unfortunately reduced the practice of evidence-based approaches to policy formulation and implementation.
Productivity is about how inputs relate to outputs – the fewer inputs used to produce a given output volume, or the more output obtained from a given volume of inputs, the higher productivity is said to be (Crafts, 2004, p.25). A special aspect of public services, such health and education, derives from the prevalence of market failures, the value of their outputs and the requirement of public finance to provide them in an efficient and equitable manner. The combination of these factors ensures that public sector productivity (efficiency) is a key determinant of raising both productive potential and quality of life. Public sector efficiency boosts productivity and living standards by increasing the availability of key services and alleviating the tax burden on the private sector (Crafts, 2004, p.23). Equally, an inefficient public sector will act as a drain on resources. The main analytical problem with making efficiency savings through boosting public sector productivity is that measuring public sector productivity is difficult because generally no prices can be observed in the public sector.
Crafts notes that public services are often subject to long chains of principalagent relationships and hence a problem of organizational design at each link in the chain is one of ensuring that someone works effectively on behalf of others (Crafts, 2004, p.35). In the private sector, competition mitigates the problem, shareholders can easily monitor managerial performance and contracts can be created to reward superior performance. In the public sector this is far more difficult. Likewise, even the mere threat of entry may stimulate efficiency of monopolists in the private sector; in the public sector this insight has been more difficult to apply.
For example, the empirical evidence such as it is suggests that educational 'outputs' (attainments measured by international mathematics and science tests) are determined far more by the institutional/organizational arrangements that exist rather than the amount of resources (inputs) provided per pupil (Crafts, 2004, p.38). These international differences in turn have been traced back to differing incentive structures. The introduction of performance targets into the public sector, which is one institutional response to the problem of weak public sector incentives, is replete with problems. For example, actors may shift towards tasks with measurable targets away from tasks that cannot easily be measured. The inhibition of innovations unrewarded by the scoring system and creative accounting may likewise plague attempts to raise public sector efficiency through target chasing.
The difficulty of using targets as a motivating device in the public sector suggests that competitive pressures may be a better route to reducing principal-agent problems. However, even the benefits of public sector competition may be associated with costs: ill-informed consumers may make poor decisions, access to services may become more unequal and compliance costs may exceed any efficiency benefits. However, Crafts shows that the evidence suggests that despite problems it is competition rather than performance targets that will encourage better public sector service delivery (Crafts, 2004, p.44).
The benefits from greater competitive pressures within the public sector are not the only policy recommendation supported by empirical evidence. Social costbenefit analysis (CBA) is another policy tool that the evidence suggests provides a useful way to raise public sector efficiency. CBA offers a model of investment appraisal that can be amended to allow for equity and environmental concerns for instance. Of vital concern to policy-makers is the fact that it allows for fund allocation between sectors. It is essential however if evaluation is to be made comparable that that the same CBA framework is used across the public sector. For example, if a sector did not use the same framework as the rest of the public sector, this lack of uniformity might lead to a distortion of resources.
In the NI context, there does not seem to be any lack of evaluation. However, greater transparency on the framework used would allow for greater confidence that efficiency was been pursued. This author finds the lack of transparency on economic advice provided within the Northern Ireland Civil Service (NICS) and other bodies such as Invest NI an unfortunate obstacle to pursuing economic efficiency. Likewise, it is unclear whether the allocation of time between evaluations and longer-term projects would yield the greatest efficiency gains. The lack of any formal links between economists in the NICS and academia, that this author is aware of, is regrettable for both parties as well as the general attainment of economic efficiency.
3. Labour Market: training
The training and skills budget will be crucial in addressing both the immediate situation and over the longer-term. Job losses in areas such as construction will not be offset in the foreseeable future. Even when cyclical recovery comes unemployed workers may not share in the job creation that will follow. It is essential therefore that training policy help workers retrain out of areas-such as construction- that are unlikely to see revival in the foreseeable future.
Liam Delaney has recently surveyed some of the lessons for training policy in the Republic of Ireland from the contemporary empirical economics literature. His analysis is equally pertinent to the situation here on the northern side of the border, his general finding is that:
In terms of a policy response to the jobs crisis, the first point to be made is that a short-term response has limits when divorced from long-run strategy. More emphasis on the foundations of learning must underpin such a strategy, from early childhood education to curriculum reform. Strengthening these cornerstones will ultimately better prepare later generations for the vagaries of the modern labour market than the current one has been.
These comments should be echoed in Northern Ireland. The evidence from economics indicates that successful policy frameworks need to be agreed upon and implemented over the long-term. Delaney argues that the evidence indicates that firstly, highly generic courses for the unemployed provided by the state do not appear that costeffective a means of raising employment prospects. Secondly, the graduate labour market may be worth more consideration by this committee (and indeed others). Delaney notes that the Irish Business and Employer's Confederation (IBEC) has been running a programme matching graduates to companies for internships.
Delaney's analysis and the emphasis he places on the education of the very young reflects the argument made by James Heckman, Nobel laureate in Economics, that adverse home environments place very young children at a significant social and economic disadvantage in the United States. Heckman argues that as a matter of both efficiency and equity shifting resources towards these groups will benefit not only these children by offering them greater aspiration, but will help society as well. The applicability of Heckman's insight to Northern Ireland is obvious. The co-existence of social depravation, educational inequalities and low productivity suggests that Northern Ireland would be a prime candidate for Heckman's analysis. In turn this has important long-term implications for spending budgets within the education sector.
4. Labour Market: Public Sector Pay
Public sector pay accounts for more than half of UK government final consumption expenditures (Elliott, Bell, Scott, Ma and Roberts, 2005, p.520). The proportion is probably higher still in Northern Ireland, which has a much larger share of labour force in this sector. Given that public sector wage bargains are an influence on private sector pay levels, they serve as a policy lever that can affect regional labour markets. The much flatter public sector wage structure in the UK when analysed in conjunction with the steeper private sector wage profile implies that the public sector pays above the private sector market rate in some parts of the UK (e.g. Northern Ireland) and below in others (e.g. London). Such a situation in the context of devolution can give rise to efficiency losses (and equity gains) because the institutional structures for pay settlement do not map onto the new devolved structures. This is an efficiency loss, despite representing an equity gain, because public expenditures are devoted to public sector pay that could be more optimally used in other areas of expenditure (Elliott, Bell, Scott, Ma and Roberts, 2005, p.521).
Two further long standing observations of direct relevance to efficiency savings in the Northern Irish economy can be made. Firstly, the wages of the UK public sector are often highly centralized. This observation has led to the hypothesis that while some public sector job holders in Northern Ireland are the 'winners' from this situation, others are priced out of the market. One famous study suggests that Northern Ireland's poor unemployment record over the long-run can be traced back to this mismatch. So far as this writer is aware, while there are some historical studies on the pre-current devolution years there has been little more recent empirical research on the post-devolution period, but clues can be found in empirical work on the Scottish and English regional economies. Secondly, unemployment is likely to exert greater downward pressure on (profit-seeking) private sector employers than on public sector pay rates (Elliott, Bell, Scott, Ma and Roberts, 2005, p.523). The greater the proportion of public sector employment in a region then, all other things remaining equal, the weaker the relationship between regional unemployment rates and pay rates will be, and the greater the associated inefficiencies that will exist.
Elliott, Bell, Scott, Ma and Roberts (2005) (henceforth Elliott et al) present a detailed analysis of the economics of public sector pay at the regional and national level. Public sector pay is not only a determinant of current expenditure, but it is also a crucial determinant of the quality and range of services that can be provided. Elliott et al are particularly concerned with the way that most public sector wage bargains are struck at the national level with little concern for regional economic conditions. In their paper, which uses data from the Labour Force Survey for 1996 to 2002, they are worried with how Scottish regional labour market conditions deviate from the UK average. While the author has not performed a similar empirical exercise for Northern Ireland, it is highly probably that the findings of Elliott et al can be replicated in Northern Irish labour market conditions.
Elliott et al demonstrate that public sector workers towards the lower end of the pay distribution are paid more than their private sector equivalents: whereas those at the upper end were paid similarly. The paper uses the data set to model the possible implications of a reform in public sector pay setting institutions that aimed to bring Scottish private and public sector pay into line. The authors conclude that there is a trade-off between efficiency and equity: bringing public sector pay into line would raise pay inequality, but reduce the efficiency losses. In the Northern Irish context similar modelling has not yet occurred, but similar conclusions would probably follow. While the pay of the lowest paid public sector workers should not be reduced, there may be a case to consider the public sector wage bargain as it affects higher paid workers.
References
Crafts, N. (2004), High Quality Public Services for Scotland (Glasgow, Allander Series).
Delaney, L. (2010), 'Key to boosting jobs lies in training and placement', Irish Times, November 3rd, 2010.
Elliott, R., Bell, D., Scott, A., Ma., A and Roberts, E. (2005), 'Devolved Government and Public Sector Pay Reform: Considerations of Equity and Efficiency', Regional Studies, Vol.39, No.4, pp.519-39.
Independent Expert Group (IEG). (2009), Final Report-The Consultation Response (Edinburgh, Heriot Watt University).
Independent Review of Economic Policy (IREP) (2009) (Belfast, Invest NI and DETI).
PricewaterhouseCoopers. (PWC) (2010a), Making the Most of Devolution (Belfast,PWC).
PricewaterhouseCoopers. (PWC) (2010b), Business as Usual? The Need for Radical Change to the Delivery of Economic Policy (Belfast, PWC).
Varney, D. (2007), Review of Tax Policy in Northern Ireland (London, HMSO).
John Simpson
Impact of the CSR for the Northern Ireland Executive
Issues for discussion with Committee for Finance and Personnel
The context:
a. N.Ireland allocation falls (in real terms) by 8% for current spending and 35% for capital over the next four years. A four year perspective should be applied in setting the future Executive budgets with year 1 being agreed and definitive and years 2-4 provisional.
b. Expectations that Treasury will agree significant concessions should not be made. There might be variations for security linked excesses but only if there are exceptional events and pressures.
c. The allocations for Northern Ireland are similar, with Barnett calculations, for Wales and Scotland. The Scottish budget proposals offer a useful read-across.
d. Any suggestion that Treasury should treat NI as a 'special case' is unlikely to make major differences. This restrictive comment is re-enforced by the proportionately lower payments by NI households in terms of domestic rates, water charges, and rents for NIHE housing.
e. Household incomes in NI are lower than UK average but (with lower Government imposts and slightly lower cost of living) average household spending in this region is one of the highest.
f. The rate of reduction in current spending, at 2% pa, is (itself) not prohibitive. The capital budget poses more demanding choices.
g. There have been some considered responses to the CSR by other organisations such as CBI and NI Chamber of Commerce. There seems to be no mechanism for the various suggestions to be answered or rebutted by Ministers (or Officials). If the submissions are well developed, should there be a public forum for further exchange of ideas.
h. CBI argues that its proposals could save £1.1bn on current spending. That would nearly meet the CSR constraints
i. Local vested interests will be protective: 'services before profits,' retain jobs. Change ideas must show when these arguments are not compelling. Longer-term benefits will sometimes call for short-term dislocation and discomfort.
Questions posed by the Committee: how to ….
1. Safeguard long-term goals whilst managing immediate budget cuts
2. Areas for new or increased revenue generation
3. Achieving longer-term efficiency savings
4. Potential savings from outsourcing public services
5. Possible capital assets realisation
6. Alternative sources of debt finance
7. The impact of AME cuts
8. Other strategic budgetary considerations [sec.75, demography, preventative spend]
Responses
Commended options in 'bold'
1. Safeguard long-term goals whilst managing immediate budget cuts
The long-term goals
Economic development
Priority to training and skills programmes, esp. Further Education
Priority to key infrastructure investment relevant to economy
Reconsider priorities in ISNI
Importance of clear political consensus
Social protection
Parity of social security changes (+/-) (incl. housing benefit)
More selective policies for social housing
Constrained protection for NHS spending
Immediate budget cuts
See comments, below, on efficiency savings
Also see comment below on public sector costs
2. Areas for new or increased revenue generation
The erosion of the real value of the Domestic Regional Rates might be reversed or even made good.
The application of rates might be made selective
Consideration of the Scottish proposal to place higher rates on large retail outlets, particularly those located in out of town centres (presumably with free car-parking).
Water charges, either directly imposed or hypothecated through rates
Key criterion: to develop a self-financing NI Water so that it could raise its own financial capital
Generic car parking charges through employers and local government
Increased fees for motor vehicle tests
Selective change in charges for prescriptions
Selective NHS charges (eg. Prescription costs, A+E)
For capital revenue suggestions, see below
3. Achieving longer-term efficiency savings
Annual efficiency savings, as cash saving targets, should give a baseline for each department and its agencies.
Target to reduce cost of Senior Civil Service by 25% in four years (as in Scotland)
CBI suggests a£125m reduction in employee costs plus reduced pension contribution costs
CBI suggests savings from reduced duplication and better procurement
Pressure to reduce sickness absence
In parallel, freeze on public sector pay as in other parts of UK (also taking account of forthcoming changes in public sector pensions provisions)
A critical examination of detailed proposals by CBI, including re-engineering services in health, housing, prisons and education
NHS to consider English system for GPs to contract acute and tertiary services
Develop some consensus of reform of education provision and estate and, at least, implement ESA plans
Review of public procurement systems
An independent review of the operational delivery of public services. modelled on lines of McCarthy project (RoI) or Campbell Christie review in Scotland.
This review should not be conducted from within the public services affected
A targeted action plan to reduce the number of NDPBs, particularly where services can be reduced or restricted
4. Potential savings from outsourcing public services
Motor Vehicle testing
Market testing of some public transport services: Ulsterbus and/or Metro
Market test Rate collection
Market test selected health and social services e.g Medical physics, catering
Prison and prisoner management
5. Possible capital assets realisation
The review by Ed. Vernon should be considered by the Committee and updated as a method of preparing for asset sales in more favourable market conditions
6. Alternative sources of debt finance
Transfer any underspend on revenue budget in 2010-11 to capital
As proposed in Scotland £100m
Reconsider budget allowed for revenue financed investment –PPP- schemes
As proposed in Scotland: allow an addition of 1% to revenue spending, converted to capital equivalence: £500m pa in Scotland, possibly £200m in N.Ireland
Introduce Non-Profit Distributing conditions to get better value for money from new projects
Make NI Water a 'mutual' or a NPD organisation to take it out of DEL capital allowances
New institutional arrangements (stronger Strategic Investment Board), modelled on Scottish Futures Trust
Consider TIF schemes (Tax increment financing) where assets will generate revenue
A Northern Ireland JESSICA fund drawn on the European Investment Bank
7. The impact of AME cuts
Scope for local non-parity action is limited
8. Other strategic budgetary considerations [sec.75, demography, preventative spend]
Political services costs: reduced political salaries
Streamline Government departments
Fees for services: [CBI suggests] FoI requests, museum entry (except for local students), planning approval fees.
John Simpson
29.11.2010
Victor Hewitt
The CSR and the Future of Public Spending in Northern Ireland
The Comprehensive Spending Review announced on 20 October will have a profound and ongoing impact on the finances of the Northern Ireland Executive. Starting next April decades of constantly rising public expenditure will abruptly come to an end and public services will have to come to terms with the challenge of balancing diminishing resources with rising expectations. In short the engine of growth upon which we have relied for decades has gone into reverse in the middle of a recession. No one should underestimate the impact of this change.
This paper looks at the facts of the CSR outcome including some issues that are significant for the Executive but which have not received much attention. It then examines briefly the options in both the short and the long term for addressing the reductions in core expenditure that are now in prospect.
The CSR Outcome
The Baseline Controversy
Immediately upon publication of the CSR outcome for Northern Ireland there was a conflict between the Treasury's calculations of cuts amounting to 6.9% of resources over four years and the figure put out by the Finance Minister, Sammy Wilson, of an 8.1% cut over the same period. The difference in views can be traced directly to the different assumptions each party made about the starting baseline expenditure in 2010/11. Table (1) sets out the reconciliation between the DFP and Treasury positions.
Table 1: Reconciliation of NI Opening Baseline with HMT Figures
2010/11 £bn
| Resource | NI Departments | 8623.9 (2010/11 revised resource DEL baseline) |
| Min of Justice | 1262.8 (2010/11 policing and justice resource DEL baseline) | |
| Total (DFP Figure) | 9886.7 | |
| Less | 95.4 (Resource share of emergency budget cut) | |
| Less | 81.1 (Student Loans) (Treasury adjustments) | |
| Less | 395.4 (Depreciation, Impairment etc) | |
| CSR Resource figure (Treasury Figure) | 9314.8 | |
| Capital | NI Departments | 1142.6 (2010/11 capital DEL baseline) |
| Min of Justice | 80.3 (2010/11 policing and justice capital DEL baseline) | |
| Total (DFP Figure) | 1222.9 | |
| Less | 45.6 (Capital share of emergency budget cut) | |
| Less | 6.8 (Treasury adjustments) | |
| CSR Capital figure Treasury Figure) | 1170.5 | |
As is evident, the Treasury stripped out as much as they could from the baseline, including counting the £128 million of cuts within the year the Executive had to find as a consequence of the Spring emergency budget and removing depreciation and impairment charges. This results in an apparently lower fall over the CSR period for the NI Block. Removing items such as depreciation seems legitimate since these are anyway ring fenced within the DEL the other adjustments have a more presentational impact.
The Outcome in Real Terms
While the CSR is announced in cash what matters on the ground is the real spending power available to the Executive. This in turn depends on the inflation assumptions used. Figure (1) shows the real terms decline in both the resource (current) and in the capital Departmental Expenditure Limit (DEL) for the Executive from 2010/11 to 2014/15, using the Treasury's forecast deflators.
As is apparent the current expenditure available falls broadly in line with inflation but capital expenditure falls very much more rapidly, by as much as 40 percent, over the CSR period. These are straightforward consequences of the application of the Barnett formula to cuts in comparable services in England. Indeed the Barnett formula actually protects Northern Ireland to a limited extent from the worst of the cuts in England because it is based on population proportions whereas Northern Ireland generally accounts for a higher proportion than that of the comparable expenditure baseline.
Figure (1): NI Executive's Resource and Capital DEL 2010/11 to 2014/15 at 2009/10 Prices
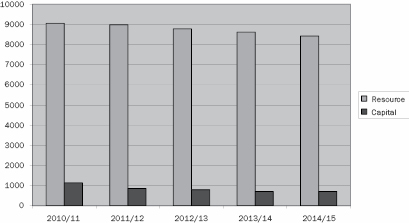
Two further points are worth noting. First, up to 2010/11 the trend in both current and capital spending has been rising and public services have in large measure been aligned with that trend. Now that public expenditure is on a downward path the gap between what had generally been anticipated for expenditure and what can now be afforded is opening much faster than merely referencing to 2010/11 alone. This is why the adjustment will be more painful than the superficial figures suggest.
Second, the deflators used by the Treasury to represent inflation are generally quite low and not specific to the sort of inflation experienced in parts of the public services, such as health. If public sector inflation turns out to be higher than for the economy as a whole, the quantity of services that can be delivered with the cash available will be much lower. Since public sector pay carries a large weight in overall public sector costs it is a factor to be considered in this equation.
The £18 billion Capital Plan
One of the most heated disputes to be triggered by the CSR settlement concerns the future of the Investment Strategy for Northern Ireland and in particular the status of the £18 billion that the Executive believe was pledged by the former Labour Government to be spent in the decade between 2007/08 and 2016/17. With the CSR removing over £1400 million cumulatively from the conventional capital baseline over the next four years how is this to be replaced? The Treasury view is that the £18 billion pledge is already half way to being met and the programme will run two years beyond the present CSR. However, they have retrospectively included expenditure on capital, including the value of Private Finance Initiative projects, in the law and order category in the years before these responsibilities were transferred to the Executive and may have extended their calculations to calendar rather than financial years which would extend the period of the pledge. On the other hand, some in the Executive have been arguing that investment financed from the sale of surplus assets or procured through PFI deals were not supposed to be part of the £18 billion. That is clearly wrong since the published projections for the Investment Strategy clearly embrace both asset receipts and PFI alongside conventional capital.
Confusion on these basic points is very regrettable since the Executive chose to pitch its claim for lenient treatment in the CSR more or less solely on the preservation of the Investment Programme. With the CSR books now closed the prospects of any deal on capital seem very slim.
Other CSR Effects
There are other unpleasant consequences for Northern Ireland that come out of the CSR but which have not been much commented upon. The first is the ending of the End Year Flexibility (EYF) scheme for public expenditure in the UK as a whole. EYF is an integral part of multi-year budgeting and allows for money not spent in one year to be carried over to future years. In some instances it is sensible to plan deliberately to under spend in an earlier year in anticipation of heavier pressures later on. Every department has built up a stock of EYF with the Treasury and in Northern Ireland's case it was, exceptionally, agreed that access to this stock would be automatic. On this basis DFP believed they had access to around £312 million. With the sudden ending of the EYF Scheme that money has been lost. A replacement scheme has not yet been put in place but is certain to be less generous.
The second disappointment concerns access to the UK reserve. With the transfer of policing and justice powers to the Executive it was believed that should the security situation deteriorate access would be granted to the reserve without a call being made on resources earmarked for other Executive departments. That belief appears to be false. Access to the reserve will still be possible but the first port of call for additional resources for security will be the Executive's wider budget. There is slightly better news concerning the EYF accumulated by the NIO since at least some of this seems to have been preserved. More generally policing and justice will confront the Executive with major financial pressures despite the financial package that accompanied the transfer. That package was mostly focused on resolving historic cost pressures such as pensions and legal claims and it is ambiguous enough to cause major difficulties in interpretation about capital and other programmes for this sector. Law and order has a way of forcing itself to the top of the expenditure agenda that local politicians have not experienced for a generation.
Less obviously, it is worth noting that in England the CSR removed over £4 billion in teaching grant for the English universities and further education colleges with the shortfall to be made up from higher fees for students. The teaching grant is a comparable expenditure under the Barnett formula so at a stroke a large part of the support for Northern Ireland's universities, amounting to more than £100 million per year, has become unfunded in the sense that nothing is coming through the Barnett formula to support this expenditure. This will face the Executive with very difficult choices in this sector.
It should not be forgotten that the CSR was concerned not only with departmental expenditure but also controlling the welfare budget. This expenditure scores to Annually Managed Expenditure (AME) and although administered by the Executive is not controlled by it. Nevertheless the Northern Ireland share of this expenditure is still an inflow to the local economy and with £18 billion of savings targeted for the UK as a whole this could translate to upwards of a £1 billion loss for the region.
Finally, we may note the curious emergence of the Presbyterian Mutual Society (PMS) problem as a key issue in the Northern Ireland settlement in the CSR. Without going into the merits of the agreement with the Treasury, resolving this problem has meant the Executive incurring a further £175 million of debt for the foreseeable future and finding £25 million of additional expenditure which will be at the expense of other services at a time of falling resources. Perhaps more to the point this episode has expended an extraordinary amount of political capital with the UK government just at the point that the Executive needed to focus all of its energy on mitigating the most severe threat to public services in a generation.
Where do we go now?
The CSR is over and there is no realistic prospect of the UK government re-opening it for Northern Ireland so the Executive has to look to its own actions to manage the budget it has been allocated over the next four years. This will not be easy and genuinely difficult choices will have to be made but at the same time a hard budget constraint provides the perfect opportunity to think radically about what public services are really needed, how these can be delivered and how they are to be funded.
A Zero Based Review
The first task is to undertake a proper zero based review of all programmes to assess their true value against the cost of providing them. This is both a technical and a political exercise but a thorough and dispassionate analysis must come first before it is finally shaped by political judgement. Such an exercise should have been started some time ago when the first indications of how severe the cuts to the Block would be became apparent but there is still time to complete it before budgets are settled. At the technical stage nothing should be ruled out save that which is genuinely impossible. Politicians will make the final decisions but they need to have unbiased information to help them do so.
An important aspect of such an exercise is to distinguish between what expenditure is genuinely inescapable or at a minimum contractually committed since this will give a clearer view of what can effectively re-prioritised in the short to medium term and what can not.
A further advantage of a review is illuminate what are the real priorities of the administration. At present the Programme for Government declares the economy to be the top priority but this is an illusion. The real priority of voters is the health service followed at some distance by education, and in response to the present circumstances jobs of whatever nature can be preserved or created.
Public Sector Costs
Efficiency savings and cost cutting measures can play a vital role in protecting services and jobs. Since more than half of all expenditure is on public sector pay ring fencing this when the Block is shrinking is a guaranteed way of shedding jobs and services. There are clear but uncomfortable trade-offs to be faced in this area. It is also the case that strict control is needed in the growth of 'unfunded' commitments such as water subsidies and now also higher education funding.
There is also scope for introducing more competition to public service provision. Some of this could come through direct competition as for example in opening the bus system to private sector operators. Some can be done through the procurement system and aggressive market testing of activities currently in public sector provision. It may be argued that this is merely substituting private jobs for public sector jobs but if an equivalent service can be supplied more cheaply that is how efficiency is gained. It is also no use complaining that the private sector is too small if they are deliberately excluded from areas of potential business without good reason.
Revenue
Although there are some interesting new ideas on how the Executive could raise additional revenue the simple truth is that they cannot be implemented quickly and some may be beyond the Executive's powers. In the short to medium term the only means available for general funding are the domestic and non domestic regional rates. That said the rate base in Northern Ireland is not extensive and has been hollowed out by popular but costly reliefs. In 2010/11 the estimated rate yield is £286 million from the non domestic rates and £270 million from domestic rates. As an approximation a 1% increase in the non domestic rate raises £3 million while a 1% increase in the domestic rate brings in an extra £2.8 million. Clearly huge rate increases would be needed to begin to cover the CSR losses.
Of the potential but untested proposals for new revenue streams the notion of a 'text tax' created not directly (this probably exceeds the powers of the Executive) but by super-rating mobile phone masts is quite attractive given the size of the tax base (millions of texts and calls) though the companies will try to pass the cost onto the consumer. As with many other suggestions this would require legislation. The idea of a surcharge on MOT tests is also straightforward though regressive. In this case it might be better to auction off licenses to run MOT centres to the private sector but to cap charges to prevent exploitation. There are also politically uncomfortable options for charging for services, including museums and libraries and clawing back on benefits already granted such as prescription charges and free travel but the gains are probably not worth the grief at this stage. We should not, of course, compound the problem by making any further concessions available.
The elephant in the room remains, of course, water and sewerage funding. This subsidy currently costs £200 million per year which is a direct trade off with other programmes because there are no 'Barnett formula consequentials' in this area, the English equivalents being in the private sector. The obvious solution is privatisation of NI Water which would remove it from the public accounts but there is no political appetite for this. The other option is mutualisation, perhaps with a declining public subsidy to ease the transition. In either case direct charging would be a consequence.
On the capital side asset sales have a vital role to play in funding new investment but the market is weak and likely to stay that way for the foreseeable future. Equally the appetite for Public Private Partnerships is waning given the complexity of these deals and the true long term costs. In the face of these constraints and rapidly declining levels of conventional capital funding it is probably inevitable that a less ambitious investment programme will have to be contemplated.
As with revenue raising there are many proposals for raising more money for capital through, for example, borrowing or leveraging existing public sector assets. None of this is simple and although special purpose finance vehicles can be created readily in the private sector the test in the public sector is whether all of this finds its way back to the UK public sector borrowing requirement as most of these schemes do. At a time when a very painful consolidation is taking place precisely to lower the public debt (or at least increases to it) it would be bizarre to propose schemes that will do precisely the opposite.
Finally, a word is in order about transferring current expenditure to the capital budget to maintain the construction industry. In many ways this is a zero sum game, what the construction industry gains in terms of jobs saved is offset by the jobs lost in the rest of the economy because of the cut in current spending. Indeed if specialised construction activities (even road building) are protected the labour required for them could actually come from outside Northern Ireland. That is why these proposals need to be looked at very carefully.
Strategic Public Expenditure Planning
The institutional and political arrangements in Northern Ireland make strategic public expenditure planning quite difficult to achieve. Service delivery is spread among a number of departments each with a given budget that is largely historically determined and committed to a range of programmes. But strategic issues are typically cross cutting in nature such as the wellbeing of children or the elderly or the development of the economy and these typically have no clear line of responsibility. Co-ordination of the activities of individual departments in relation to strategic themes is conducted through constructions such as the Programme for Government which sets broad priorities for the Executive's objectives. There is not, however, a corresponding co-ordinated budget to set against these priorities nor even a clear and meaningful ranking between them. On the political front, Ministers hold office not by invitation of a Prime Minister but by virtue of a representative mechanism. Creating agreement on the division of resources between Ministers is therefore a fraught business at the best of time and exceptionally difficult when cuts not increases are in prospect.
Nevertheless, there are ways in which public expenditure planning can be made more strategic and improve co-ordination. One of these is to create actual pools of money to back up cross cutting priorities and to make access to these funds dependent on joint bids by departments. This was the idea behind the 'Executive Programme Funds' in a previous Assembly. These Funds covered areas such as Children and an embryonic cross-cutting capital fund and were financed by top slicing the public expenditure block. In practice relatively few genuine cross departmental bids were made on these Funds.
Another approach is to mobilise a multi agency (and also multi-departmental) 'Task Force' to focus on some common theme. This can either be given a separate budget (again by top slicing) or draw upon parent department funds. An example was the 'Making Belfast Work' initiative in the 1990s.
Rebalancing the economy
When the loss of welfare expenditure is added to the reductions in the Executive's budget more than £5 billion will be taken out of the economy over the next four years. Given the size of the export sector which is the only part of the private sector now capable of driving growth it will be barely possible to make up this loss with the current structure of the private economy. Unless therefore the private sector can be encouraged to grow beyond its current trend the economy is likely to be flat for a considerable period of time with growing unemployment and out migration of the most productive. In the short term this points to swift action to promote more jobs (even at less than the existing median wage) using the tools available to InvestNI. In the longer term there is a desperate need for radical new incentive mechanisms for the private sector such as a reduced local rate of corporation tax. The economic development model that Northern Ireland continues to rely upon, which is selling the region as a relatively low cost place to do business, is increasingly becoming unfit for purpose. The forthcoming consultation paper from the Treasury on rebalancing the Northern Ireland economy is therefore a critical opportunity to forge a new growth focused alliance between the Executive and the UK government, it must not be missed.
Victor Hewitt
November 2010
Martin Skidelsky
NYRB Essay Plan for a National Investment Bank by Robert Skidelsky and Felix Martin, Thursday, 2nd December draft.
i. The fundamental issue raised by Keynesian economics is 'the stability of the dynamic system….its ability to return automatically to a full employment equilibrium within a reasonable time (say a year)' following a large shock.[1] Keynes's fundamental innovation was to deny that a market system possessed an automatic recovery mechanism –or at least he said that it was too weak and uncertain to bring an economy back to 'full employment', in a 'reasonable time'. This justified a government (or 'exogenous') injection of aggregate demand to avoid a prolonged period of depression or recession.
The collapse of 2008-9 has offered us a test of the Keynesian hypothesis. The general view is that the strong coordinated response of autumn 2008 and spring 2009 put a floor under the downward slide and averted another Great Depression. The recovery which started this year is seen as proof of the vigour of 'natural forces'. In fact, the recovery is being fuelled by stimulus programmes which are now being withdrawn. The likelihood is that it will peter out before full employment is restored. PIMCO's Mohamed El Erian has talked of a 'bumpy journey to the new normal', a normal which he implies is well below the old normal.[2]
The situation we face can be summarized in four propositions. First, aggregate demand is deficient, and needs to be bolstered in order to restore employment to a reasonable level within an acceptable span of time. Second, it has become politically impossible to increase the general government deficit. Third, because of pervasive uncertainty and debt overhang, private sector demand is not likely to respond to monetary stimulus policies, conventional or otherwise. Finally, because the current slump was specifically precipitated by a massive financial crisis, confidence is shot, not only in the prospects for demand, but in the existing system of financial intermediation itself.
This is the context for our proposal for National Investment Banks to invest in accelerated projects of capital development.
ii. The disablement of fiscal policy
The Keynesian rationale for running an increased budget deficit in a recession is that the government is the sole agency able to prevent total spending in the economy falling below a reasonable level of activity and employment. If private spending is depressed the government can restore total spending to a reasonable level by adding to its own spending or reducing taxes. In doing so it will be adding to a deficit which is already the result of falling revenues and rising social benefits due to the recession. The deficit's function is to sustain the total level of spending and output in the economy. Any attempt to reduce it while large spare capacity exists will only make matters worse. If the economy is severely 'under-employed' the deficit will not 'crowd out' private spending. It will replace private spending which is not taking place.
The Keynesian case for deficit spending is challenged by the theory of 'expansionary fiscal contraction'. This states that, on the one hand, a public deficit will 'crowd out' private spending by depressing consumption (households will save more to pay anticipated higher taxes), and will depress investment (since interest rates will have to rise). On the other hand, 'fiscal consolidation' will increase household consumption (since households no longer anticipate increased taxes) and also investment (by making credit cheaper). Despite the highly unreal conditions needed to validate the theory, and the negligible empirical evidence in its support, 'fiscal consolidation' has become more or less the new orthodoxy in Britain and Europe, and to a lesser extent in the USA.[3] In its name, most OECD countries have agreed on four or five year deficit liquidation plans, and it is likely the USA will follow suit with some version of the Simpson-Bowles proposals.
Because of this ideological stance, it would be unrealistic to expect any further help from direct fiscal stimulus in the near future. This leaves monetary stimulus – cutting interest rates; or when that is exhausted, quantitative easing – whose intended effect would be to offset fiscal contraction. This indeed is the preferred option of that section of the ideological Right which accepts that 'Keynesian' under-employment is possible, but wants to keep the government out of the stimulus endeavour. In November, Federal Reserve Chairman Ben Bernanke started a new programme of quantitative easing to the tune of $600bn; UK Bank of England Governor Mervyn King may follow suit in the new year; and Jean-Claude Trichet has hinted that even the hawkish European Central Bank may do the same. The questions are: how are such programmes expected to work? What is the evidence for their stimulative effect?
iii. The Uncertainties of Quantitative Easing
Quantitative easing involves the central bank (or Fed in the USA) buying securities from private financial institutions using newly-created base money. It is resorted to when, with a fixed quantity of base money, the central bank cannot push interest rates any lower. In it most orthodox version – as practiced by the Bank of Japan in the early 2000s, or the Bank of England today – the central bank is seeking simply a continuation of its control over government, or 'risk-free', interest rates alone, and therefore purchases only government bonds with the newly-created money. If the central bank desires directly to influence rates in particular private credit markets as well, however, it may buy private sector mortgage or corporate bonds instead. In the USA, the Fed has done both (and prefers to call the latter credit, rather than quantitative, easing).
Economists disagree about exactly how this type of operation is supposed to stimulate the real economy. The most widely accepted explanation runs as follows. When the central bank purchases existing securities from financial institutions using newly created reserves, those institutions find themselves with too much cash in their portfolios, relative to what they believe themselves to need to fund their liabilities. They therefore go out and buy substitute assets. Since whoever they buy these substitute assets from then find themselves in the same predicament, this process then repeats itself, until the prices of all assets rise to bring the cash balances of all institutions in real terms back to where they were before.
This inflation of asset prices is argued to have two real economic effects, known as the 'wealth' and the 'portfolio balance' effects. Proponents of the wealth effect believe that its main impact comes from the increased net worth of the private business and household sectors. People and firms feel wealthier, and so are willing to consume and invest more. Advocates of the portfolio balance effect, on the other hand, stress the lowering of interest rates in private credit markets. The idea is that this additional relaxation of financial conditions for firms and households is simply the continuation of conventional monetary policy by other means, and that it will therefore stimulate borrowing and spending in much the same manner that conventional interest rate policy would in normal times.
There are a couple of interesting side effects. By depressing actual or expected interest rates below those prevailing in other currency areas, QE can weaken the currency internationally, and insofar as this improves the current account balance, stimulate aggregate demand by increasing net exports. This, of course, is what China accuses the United States of intending to do right now. To the extent that QE raises the rate of inflation, it can allow governments, households and businesses to borrow at negative real interest rates.
Does it work? The answer is we don't know for sure: it is always impossible to tell what would have happened without it. The Fed has expanded its balance sheet by $1.4 trillion since September, 2008. The Bank of England has pumped an extra £200bn into British institutions over the same period. Financial asset prices have certainly recovered, and government bond yields fallen. But banks have remained unwilling to lend, and borrowers unwilling to borrow: the expansion in reserves has not translated into a proportionate expansion in broad money and credit. In both the USA and the UK, bank lending to the business sector has in fact been contracting since late 2008 – over the last year by 8.4% and 4.5% respectively. The growth in the money supply has been anaemic – 3% over the last year in the US, as compared to an average of 6% in pre-recession years. The wealth effect has proved elusive; lower interest rates have not translated into an expansion of credit; and the Fed's strategy of targeting mortgage-backed securities has not brought about a recovery in the housing market.
There are two principal explanations for these questionable results. The first of these points to the parlous state of private sector balance sheets following the crash in housing and asset prices. The argument is that potential borrowers are concentrating on 'deleveraging' – that is, rebuilding their balance sheets – before anything else. Until they have finished this process, they will have no appetite for new lending no matter how cheaply loans are made available. The second (and complementary) explanation locates the problem in the collapse of business confidence and broad-based uncertainty as to the future prospects for demand. In 1932 Keynes explained that the challenges that result may be beyond the help of monetary policy: 'It may still be the case that the lender, with his confidence shattered by his experience will continue to ask for new enterprise rates of interest which the borrower cannot expect to earn…If this proves to be the case there will be no means of escape from prolonged and perhaps interminable depression except by direct state intervention to promote and subsidise new investment'.[4]
QE is not new, and nor are these apparent limits to its effectiveness. FDR tried it during the Great Depression, between 1932 and 1934, mainly in the form of gold buying. In John Kenneth Galbraith's summary: 'Either from a shortage of borrowers, an unwillingness to lend, or an overriding desire to be liquid – undoubtedly it was some of all three – the banks accumulated reserves in excess of [their legal] requirements'.[5] Keynes summed up in 1933 that printing money was 'like trying to get fat by buying a larger belt. [But] it is [not] the quantity of money, [but] the volume of expenditure which is the operative factor'.[6] More simply: 'you can't push on a string'.
iv. The National Investment Bank
Public banks to promote economic development are a well-established feature of many advanced economies – and indeed a National Infrastructure Reinvestment Bank was proposed in Congress in 2007 and 2009 in the US, and a Green Investment Bank was promised in limited form in the first 2010 UK budget. With successful precedents such as the German Kreditanstalt fur Wiederafbau (KfW) and the Development Bank of Japan (DBJ), as well as multilateral versions such as the European Union's European Investment Bank (EIB), there are many models for the details of operations and funding that a National Investment Bank in the US or UK could draw upon. The basic features are government ownership of the equity capital, a conservative level of balance sheet gearing, and a clear mandate to support long term economic priorities. Funding for lending operations is available from the capital markets at long tenors and at interest rates close to those the government itself borrows at, both because of the conservative nature of the lending strategy and because of the implicit or explicit support of the government – and these favourable funding conditions can be passed on to borrowers. Since funds for lending are generated from the bond markets, the main up-front fiscal cost of establishing such a bank is limited to the initial subscription of equity capital.
The traditional rationale for such institutions is that they can support economically desirable projects of long term national importance that private sector finance would not normally fund. In technical terms, they can overcome 'market failures' in the intermediation of national savings. Social and environmental projects, for example, typically have economic returns that exceed their private financial returns: a private bank can take only the latter into consideration, whereas a public development bank can incorporate the former as well. Large-scale infrastructure projects in transport or energy require financial commitments over a time frame beyond the horizon of the private sector: a public development bank can take a longer term view, and thereby overcome this market failure in maturity transformation. In the aftermath of an era in which private sector finance is seen by many as having led the structure of the economy astray in the interests of short term speculative gain, the attractions of this strategic mode of project appraisal are more evident than ever.
These traditional arguments are typically made in the context of full employment and a properly functioning financial system; and development banks are generally seen as a means of nudging a cyclically healthy economy onto a still more prosperous path. We believe that National Investment Banks can play an important role in meeting our most pressing short term challenges as well, however: the stabilisation of demand and employment on the one hand, and the rehabilitation of a traumatised financial system on the other.
The first challenge is to defeat the crisis of confidence and resolve the pervasive uncertainty. The traditional Keynesian medicine for this part of the problem is a commitment on the part of the fiscal authorities to bolster demand by increasing deficit spending – thereby providing a basis on which the private sector can plan and invest. The traditional criticism of this remedy has been that intervention by government will end up reducing, rather than increasing, confidence. The argument goes that business believes (on the basis of the practical experiences of the 1970s, and the anti-Keynesian revolution in economic thinking precipitated by them) that sustained fiscal stimulus is always and everywhere in the end wasteful and inflationary.
A National Investment Bank can square this circle. By the formulation and approval of a long term lending strategy, the government can provide assurance to private business of a long term economic and fiscal commitment. But at the same time, by creating a National Investment Bank to implement this strategy, the government can transform a relatively modest fiscal outlay into a macroeconomically significant programme of publicly-supported spending – and thereby avoid the potential pitfalls of direct deficit spending.
The second challenge is the significant debt overhang in the private sector, and the resulting desire to delever. But even if this syndrome is widespread, not all parts of the private sector have impaired balance sheets. Unfashionable sectors that did not participate in the boom times have room to borrow: and unsurprisingly, it is just those sectors whose economic and social returns exceed their financial returns – transport infrastructure, green technology, social housing, and so on – that remained resolutely unfashionable during the boom. These are the very sectors that a National Investment Bank would target even in normal times. By making credit available to these sectors now, a Bank would stimulate spending by those parts of the private sector whose balance sheets can support it.
Our current situation is plagued not only by chronically subdued demand, however, but also by a crippled financial sector. The current slump was precipitated specifically by a massive and ongoing financial crisis. As the current situation in the Eurozone amply illustrates, there has been a massive loss of confidence not only in the prospects for business demand, but in the very system of financial intermediation itself. Not only are borrowers reluctant to borrow; but Wall Street is unable to transmit central banks' accommodative policies to Main Street; savers look ever more warily at bank paper fearing haircuts and bail-ins; and the too-hasty return of egregious bonuses has left the public disgusted and sceptical of the entire system. Could a new National Investment Bank help us here?
The first benefit is self-evident. It is the hangover of impaired loans that is the most powerful disabler of the banking sector in the US and UK at the moment. Regulators and banks fear that fresh losses will materialize, and know from bitter experience that if they do, depositors and investors will run scared and funding dry up. As a result, banks are in repair mode, concentrated on recapitalizing , de-risking, and liquefying their balance sheets – all at the necessary expense of new lending. A National Investment Bank would, as a new entrant, be free of the legacy portfolios that are ham-stringing the existing banks. It would not face solvency or liquidity issues, and could play its hand freely from the start.
A second benefit would be in a National Investment Bank's ability to help the system of bank funding navigate the current, well-justified uncertainty over the need for bail-ins of private sector creditors. Modern banks rely not only on depositors, but upon the bond markets for funding. Since the disastrous experiment with Lehman Brothers, regulators have imposed a taboo on inflicting losses on bond-holders for fear that the system of bank funding will again seize up. The Eurozone banking crisis is testing the political reality of this settlement to its limits, however: why should pensioners and public servants lose out so that reckless bank bond-holders can be made whole? The urgent problem facing governments is that a complete volte-face in which the sanctity of bank bonds is universally withdrawn would traumatize the bank funding markets deeply in the short term, and further disable existing banks. A clear compromise has to be determined and clearly articulated; in the absence of one, uncertainty reigns. The establishment of a National Investment Bank can be an important step on this path to be beaten between moral hazard on the one hand and the disintegration of the funding markets on the other. By establishing a bank whose obligations would enjoy the implicit guarantee of the state, governments could clarify the status of private bank bonds, which would not.
A final – and perhaps the most important – benefit lies in the potential of a National Investment Bank to restore public confidence in banks and banking. The financial crisis has left the impression that the main purpose of financial intermediation is to enrich a tiny and boorish elite at the expense of taxpayers. Adair Turner, the Chairman of the UK Financial Services Authority, gave voice to a widespread sentiment when he said in a review of the past decade of financial innovation that much of it was 'socially useless'.[7] In fact, the public understands that a well-functioning financial system is essential to our economies: but it also understands that a massive behavioural change is required to bring such a system into being. Prudential and regulatory reform for existing banks is necessary, and will eventually have this effect. But these comprehensive efforts are complex, and new regulatory regimes in particular take time to bed in. A National Investment Bank, by contrast, would be able to adopt stricter norms from its inception, and thus to demonstrate the social value of the financial sector to a quite justifiably disenchanted public. [3163]
[3] For the theory of expansionary fiscal contraction, and evidence, see Rosaria Rita Canale, Pasquale Foresti, Ugo Marani, Oreste Napolitano, 'On Keynesian Effects of (Apparent)Non-Keynesian Fiscal Policies, Discussion Paper No.8,2007, Department of Economic Studies, University of Naples 'Parthenope'. The authors conclude that fiscal contraction may be consistent with expansion of aggregate demand if monetary policy leads to a devaluation at the same time. But it is the monetary loosening, not the fiscal contraction, which has this effect. The theory of expansionary fiscal contraction confuses a correlation with a cause.
[5] J.K.Galbraith, Money……; the best account of the Roosevelt experiment in QE is by L. Chandler…..
[7] Interview in Prospect, August 2009.
Dr Brownlow - Liaison with Economists
As a former civil servant I was puzzled and disappointed with DFP's response. The response was (arguably) evasive and (unarguably) confused. It engaged with none of the points that I made in my evidence. I'd note in response to the DFP letter 13 December compared with my evidence that:
1. In my evidence my concern was with the lack of any formal organizational links between the civil service academic economists at either of NI's two universities. The lack of intellectual independence of bank/consultants talked about in the letter has nothing to do with the observation made in my evidence about academics links to policy-making (DFP's awkward and obvious attempt to sidestep the issue indeed confirms my thinking on the matter).
2. My observation on the GES's engagement with academic seminars/conferences and DFP's non-involvement again was not addressed in the letter either. Again this confirms my view on the cultural differences between NICS economist group and GES.
3. The meeting on November 5th clashed with a conference held in Edinburgh. Many economists (including myself) attended the Edinburgh event and consequently the economist forum attendance was depleted. No inference about the NICC/Invest NI forum should be made on this one meeting. It is a fact that in none of the meetings I've attended since 2009 has a DFP economist been a lead discussant. I was baffled why DFP made any inference in their letter based on this one meeting!
4. The awarding of contracts on an ad hoc basis mentioned in the letter links to 1. While ad hoc specific research contracts have been made, this kind of exercise is no substitute for a formal evaluation of wider strategic issues. Furthermore, it is no substitute for a proper formal machinery between academic economists and NICS economist group. Again I think the DFP response seems (at best) to not address the point I made.
5. The data point again is confused in DFP's response. My evidence was quite clearly about economic evaluation and the opportunity cost of time. The publically available data was not the issue I raised, instead it was the dominance of economic evaluation in the policy-making process and the fact that comparing the results of these evaluations is very difficult. DFP's website is far from clear in communicating this kind of information. I note also that they conflate ONS data with wider methodological questions in their letter.
All in all I'm very disappointed with DFP's (non) engagement with points I raised. My hunches prior to giving evidence was that there was some resistance to evidence-based policy and with cementing greater links with academia within DFP. DFP's unsatisfactory response tends to confirm these hunches.
Yours,
Graham
John Simpson – Liaison with Economists
Kathy, for Shane
Your copy of the letters about consultation with economists has reached me.
You should know that I regard myself as an academic economist (now on the books of UUJ) who also works as a self-employed consultant. I have enquired (to put it gently) about access to the various consultative functions and have never had the pleasure of an invitation, much to my disappointment.
Perhaps you would share my disappointment that I have been knowingly excluded to the DFP and InvestNI officials.
John Simpson
Dr Graham Brownlow
An Economic Analysis of the NI Draft Budget: A Briefing Paper for the Committee for Finance and Personnel
Dr Graham Brownlow
Queen's University Management School
January 18th 2011
Summary
1. As suggested in my previous document (see Brownlow, 2010), I'd like to highlight to the Committee the need to think about longer-term issues germane to equity and efficiency.
2. Again, as with my previous document, I'm distinctly unclear about the evaluations underpinning some of the economic efficiency claims made in the draft budget. Moreover, the decision by the Executive to take "the hand off the steering wheel" in terms of administrative cost control seems perplexing.
3. Again I'm unclear about the precise economic reasoning that went into some of the allocation decisions outlined in the draft budget.
Introduction
The content of the draft budget for 2011-2015 tends to confirm my comments made in my earlier briefing paper (Brownlow, 2010). As I argued in that document, greater competitiveness in the private sector, a shift to revenue-raising, greater transparency and organizational reform in the public sector offer the most viable path to economic reform. The Finance Minister has little room for economic manoeuvre and the draft budget is pragmatic throughout. One way to interpret the draft budget is that it attempts to shift resources from current to capital budget to offset the potential deflationary effects of public sector cuts in a localised construction sector.
While the draft budget's foreword states that the draft budget is concerned with 'stability and strategic vision', but it is the case that the focus of the published draft budget is very understandably concerned with pursuing the former rather than the latter objective. The document acknowledges the pragmatic emphasis is on restoring public finance stability instead of promoting the strategic vision needed to boost competitiveness when it states that the Investment Strategy will set out the public sector infrastructure picture over the next decade (p.3).
The draft budget does not discuss how reductions in capital spend may affect Northern Ireland's future attractiveness as an inward investment location. This is a topic that needs to be addressed somewhere in the machinery of the devolved settlement. In addition, the budget's recognition of the need to reconcile equity and efficiency is to be praised. The proposed creation of Social Investment and Social Protection Funds (p.27) is arguably a good start along this road. The postponing of water charges is in contrast very much on the debit side. Circumstances have changed and consequently charges will probably be needed in the next decade (Hansard, 2010).
Comments on Chapter 2
The draft budget is to be praised for recognising that, despite the boom of that existed for most of the 2000s, 'a number of significant and long-standing structural challenges remain' (p.7).The document in particular highlights inadequate productivity and employment rates as examples of the challenges faced by the regional economy. The draft budget observes that these supply-side weaknesses have blocked the convergence of living standards with the rest of the UK. Likewise, the chapter observes the need to rebalance or tilt the Northern Irish economy towards a greater reliance on the private sector.
The draft budget alludes to the private sector's failings when it notes that the Northern Irish private sector has too often relied on the region's public sector for business. Again a more vibrant and diversified export-orientated private sector would naturally rebalance the economy and make it less vulnerable to reductions in UK public expenditure. The efficiency challenge (not addressed in the budget) is how to build a more diversified, efficient and export-orientated private sector. It is hoped the draft Economic Strategy (mentioned on p.15) will address this fundamental problem facing the regional economy.
My other main concern with this chapter is that the combination of job losses and long-term unemployment exhibited by Northern Ireland implies that addressing skill shortages and long-term unemployment requires a much emphasis on training (with the associated drain on the public purse). The draft budget is for the most part silent on this equity challenge and it will be up to the respective Ministers to tackle these problems in a difficult public expenditure environment.
Comments on Chapter 3
As an organisational economist I'm more than slightly sceptical that delegating expenditure reductions to department's judgements on core functions will necessarily produce the most efficient outcome (see p.29). Likewise, the decision to continue postponing the introduction of water charging (p.23) may (or may not) play well politically; it could have damaging long-term consequences for the credibility of decisions in other areas. One important consideration in the economic analysis of devolution is the nexus between the public image of devolution and the willingness of entrepreneurs to invest in the Northern Irish economy (Hansard, 2010).
For instance, potential inward investors looking at the failure to invest in the water network may have to decide rationally if the region's infrastructure network is at the appropriate threshold level. In an increasingly competitive international investment location market the right 'signals' need to be sent if investors are to be attracted to Northern Ireland. Equally, it can hardly instil confidence in local investors to see water charges being postponed. The failure to engage in any extended discussion of public sector pay (p.24) is puzzling in the light of the unemployment situation. The failure to communicate effectively the trade-off in the devolved administrations between jobs and pay rises - a trade-off that Professor Heald has highlighted to this Committee- is unfortunate but understandable (Hansard, 2010).
It is also a pity that the range of evidence on the value for money evaluations used to examine the cost-effectiveness of programmes (p.24) are not presented in the report; as the draft budget stands, we need to simply take these (rather large) set of assumptions on trust. If these evaluation results were made publically available in the draft budget it would be possible to engage in a fully transparent benchmarking exercise. The (relative) protection of the health care budget is equitable in its implications. However, such a prioritisation may not be the most efficient use of scarce resources. As a reader we cannot make judgements on the wisdom of this decision as there is no concrete evidence produced, or even referred to in the document, that suggests that a pound is more efficiently spent in health than in other uses. Similar concerns arise from the decision to end the central control of administration costs (p.29). The danger is that Ministers will have little incentive to maximize net benefits.
Comments on Chapter 4
There is little I can add to the precise composition of departmental expenditures.
Comments on Chapter 5
It is good to see such a detailed outline of equality considerations. It would however have been appreciated if more detail on EQIA had been set out in an annex (with perhaps some hypothetical worked examples). For example, I typed EQIA into the NI direct website and got no search results!
References
Brownlow, G. (2010), Efficiency and Equity Over the Longer-Run: A Briefing Paper for the Committee for Finance and Personnel', Paper drafted for NI Assembly, November 24th 2010.
Official Report (Hansard) (2010), Committee for Finance and Personnel, Spending Review and Budget 2010, 3rd November 2010.
John Simpson
NIA Finance & personnel
Northern Ireland Assembly Draft Budget 2011-15
1. Thank you for the invitation to respond as part of the discussion on the draft budget for the four years 2011-2015.
2. This is a difficult budget to assess. As a consequence of the decisions by the Chancellor of the Exchequer to reduce the scale of the UK borrowing requirement, Northern Ireland is required to plan to manage on a reducing level of public finance. Although the issue is marginal to the practical questions now posed, the public sector finances in Northern Ireland have, in recent years, benefitted from the too large increase in UK spending, relative to available funding. From a Northern Ireland perspective there would have been an easier transition if the UK policies had favoured a slower rate of adjustment. However, under the existing mechanisms to finance the devolved administrations, the impact of the UK-wide decisions is, mathematically, what could have been expected.
3. There seems to be little room to argue that local, or special, factors would succeed in claiming a more favourable settlement.
P.M.S.
4. One feature of the NI Budget that is of an exceptional nature is the financing of the bail-out of the Presbyterian Mutual Society. The extra borrowing of £175m along with an extra subvention of £25m from the Treasury (to be supplemented with £25m within Northern Ireland) lies outside the usual arrangements. There needs to be a clear statement that these funds are to be repaid, with the £175m borrowed having precedence, to the best degree possible when the assets of the PMS are realised.
5. Apart from the £25m from the Executive budget, the other parts of the deal do not impact on funds available to, or from, the Executive. However, the legal responsibility for the management of public funds in the bail-out lies with the Department of Enterprise, Trade and Investment. A clear operational policy is now awaited.
The budget balance
6. The draft budget is designed to conform with the permitted spending plans within the Treasury allocations using the Barnett formula. Additional features are the funding arrangements for the Department of Justice which are influenced by the arrangements made when these functions were devolved. Also, significant sums are allocated provisionally under the AME classification for cash services such as social security payments.
7. As this comment is being written, the draft AME budget figures have not been published. As part of the overall debate, this omission should be rectified.
8. Whilst the main details for review lie within the proposals now tabled by Departments along with the overall distribution between Departments, there should be explicit consideration of the overall budget balance. Has revenue, current and capital, been maximised and has the pattern of expenditure been assessed to match the programme for Government policies?
9. The Northern Ireland Executive has decided, on some topics, to forgo possible revenue over and above the Barnett allocation. Whilst these are decisions which lie within the remit of the Executive, in a period of reduced allocations, a reconsideration would be merited.
10. The Regional Rate is the local proxy for revenue in England that would be raised by Council Tax and Domestic Water Charges. Regional rates are now well below what would be comparable charges for any English region. The regional rates bill has been frozen for four years. The proposal is that in 2011-12 the regional rate will begin to rise in line with inflation. Arguably, this is too modest a proposal.
11. To ease the overall funding squeeze and to move, however slowly, to a position where fair comparisons can be made between tax charges in Northern Ireland in comparison with England, the Executive might introduce a phased approach to raising the rates bill. A formula of 'inflation plus 2% annually' would make a modest correction.
12. There is a serious need to balance Northern Ireland's public finances so that the costs of water and sewerage services do not take funds away from other public services. This note does not re-enter the debate about an immediate introduction of specific water charges although the concept has much to commend it in terms of equity and fairness.
13. The proposed budget is conventional and constrained in the ambitions for capital spending. The large reduction in annual allocations can be seen as a return to the lower levels of a decade ago. However, the reductions are the equivalent of the abandonment of the Investment Strategy. The hope must be that when the public sector spending squeeze eases, that Investment Strategy can be restored.
14. The Executive has made small gestures to supplement the Treasury agreed capital spending budget. However, the draft budget contains no proposals to, even for a one-off period, activate any PPP capital schemes. There are variations on PPP concepts under consideration in Scotland through Scottish Futures that set precedents that might be followed in Northern Ireland.
15. To exclude the introduction of ANY provider financed capital projects seems like a decision based on political policy without regard to the possible benefits in maintaining the investment programme and the associated economic benefits.
16. A critical omission from the budget arithmetic is the search for a mechanism that would allow Northern Ireland to raise private capital to finance investment in the water and sewerage services. The draft budget allocates nearly £200m for investment by NI Water. This investment is justified by the Regulator's assessment. However, this makes a large reduction in the available funds for other capital projects.
17. In total the overall budget balance is tighter than it could be if the Executive took a more flexible view of funding sources.
The balances within the budget
18. There are difficult decisions to be made in allocating funds between departments and then within those departments. These are likely to attract a major part of the consultative debate.
19. The responses from each department illustrate that decision making in 2011 has become a much more difficult process and there are tensions between maintaining services, protecting jobs and responding to challenges to develop services. Almost inevitably, those with responsibility for a particular service will act protectively, whether in health, housing, social security, schools or universities.
20. In the debate, so far, there has been little evidence of plans to 'do more with less'. Admittedly the search for a slimmed down service doing more by improving organisational skills is not easy to demonstrate, nor get internal support. Generic adjustments which are based on further 'efficiency savings' must be part of the theme.
21. In general, Departments have faced up with realism to the new constraints and deserve restrained congratulations. There are, of course, many assumptions that must become operational achievements. There are proposals that will be unpopular. The budget debate calls for collective responsibility from the Executive. This is proving difficult and the looming election does not help create a shared agenda.
22. Three Departments have not signed up for the proposed budget allocations: DSD, DEL and DHSSPS. A fourth has signed up for the allocation but might have drawn more forceful attention to the constraints now being faced: DETI (and speaking also for Invest NI).
23. From an external perspective the merits within each Department cannot easily be assessed. There needs to be a rational needs assessment for the health budget using a well-documented comparison with the NHS in England. Unfortunately, the debate about health service needs has moved from a factual base to less helpful political aspirations.
24. If the economy is to be a priority, then the budget allocation and the policy problems for Invest NI are most undesirable.
25. The draft budget is more orientated to minimise the impact of reduced spending on existing allocations and services. This is an understandable bias. However, the logic of making the economy a priority should be re-enforced. As drafted the budget, if anything, reduces the priority for the economy and jobs rather than enhancing it.
26. The search for a greater switch in funding to protect health service standards and to give more scope for economic development should be intensified. More careful scrutiny, on lines akin to those commended by CBI(NI), is merited. A more carefully selected trimming across a range of Departments should be possible.
John Simpson, 19.1.11
NICMA
Response to Northern Ireland Executive's Draft Budget 2011-15
Introduction
NICMA – the Childminding Association is a charity, and is the sole organisation representing childminders in Northern Ireland. Registered childminding is by far the most popular – and affordable – form of full-time childcare in Northern Ireland; it accounts for 63% of full-time daycare places and 37% of all childcare places. Thus our primary interest in the Draft Budget 2011-15 pertains to childcare and early years provision and support. Our comments refer to the main Draft Budget document, along with the documents produced by the departments which have most relevance to childcare, namely the Department for Education, the Department for Health, Social Services and Public Safety, and OFMDFM.
We welcome the fact that the Executive has produced a four-year draft budget which should enable the Executive and its departments to take a more strategic, long-term approach towards policy and resource allocation. However, in the absence of any policy framework for the development of childcare and early years provision, we are concerned that the budget proposals remain relatively general and that no specific funding has been earmarked for childcare provision or support.
We note especially that, in contrast to the Northern Ireland Draft Budget 2011-15, the Welsh Assembly's Draft Budget 2011-12 has allocated more than £120m towards expanding the provision of affordable childcare.[1]
We further note that the number of economically inactive women in Northern Ireland who report that they are prevented from seeking work due to family commitments has increased by 50% to 15,000 in the space of just nine months.[2] This suggests that thousands of families in Northern Ireland are finding it an increasing struggle to meet childcare costs, and that greater availability of affordable childcare is urgently needed.
We would therefore urge the Northern Ireland Executive to follow the lead of the Welsh Assembly and earmark specific funding for a similar expansion of affordable, high quality childcare provision and support services over the next four years.
Childcare and early years expenditure: how Northern Ireland compares
Northern Ireland is already lagging far behind Great Britain in spending on childcare and early years. Save the Children has calculated that spending on early years services in Northern Ireland in 2007/8 was a mere £630 per child, compared to approximately £2,000 per child in Great Britain.[3] Moreover, the charity found a considerable disparity in Sure Start expenditure, with just £80 per child spent in the same year in Northern Ireland, compared to nearly £600 in England, £380 in Scotland and up to £350 in Wales.
Unlike the rest of the UK, Northern Ireland has neither an up to date childcare nor early years strategy to provide a framework for expenditure in these crucial areas. We welcome the fact that the Department of Education has stated that it wishes to protect its current early years expenditure and that it has earmarked a potential total of £13.5m over the next four years towards the implementation of the forthcoming Early Years (0-6) Strategy. However, the draft version of that Strategy contained no commitment to improve or expand childcare provision or support services. OFMDFM has undertaken to take forward a childcare strategy, yet there is no allocation for the implementation of this strategy in its draft Budget statement.
Why investment in childcare is vital
The provision of affordable, high quality and accessible childcare is crucial if the Northern Ireland Executive is to deliver on its economic and poverty alleviation goals. In particular, it would help deliver on the following aims, outlined in the Executive's Programme for Government 2008-11:
- Increase the employment rate from 70% to 75% by 2020
- Work towards the elimination of child poverty in Northern Ireland by 2020
We have already noted that a total of 15,000 economically inactive women in Northern Ireland say they're prevented from seeking work by family responsibilities – this figure represents an alarming 50% rise in just nine months.[4] The increase is almost certainly due to the increasing inability of many families to access childcare which they can afford, against the current background of the economic recession.
This problem is likely to grow when the percentage of childcare costs which parents can claim through the childcare element of the Working Tax Credit is reduced from 80% to its previous 70% level in April this year.[5]
The Taskforce on Employability and Long-Term Unemployment, established by the previous Northern Ireland Executive, commissioned research which found that:
… lack of access to affordable and decent quality childcare provision [is] one of the main barriers to entering the labour market for parents, particularly women …[6]
Waldfogel and Garnham have estimated that between one half and one sixth of all children currently living in poverty in the UK could be moved out of poverty if childcare provision and access was improved.[7] Moreover, they cite data indicating that half of all non-working mothers in low-income households and a similar proportion of lone unemployed mothers would prefer to work if suitable childcare was available.[8]
A number of studies suggest that the quality of child care is especially important for children from low-income families. McCartney et al. found that the cognitive development of very young children from low-income households benefited from quality child care.[9] Other studies suggest that low quality care may have a detrimental effect on outcomes for lower-income children.[10]
Conclusion
Thus, childcare has a vital role to play in helping parents into employment, but high quality early years childcare can also help to minimise the risk that children living in poverty become adults whose lives and that of their children experience the same disadvantage.
As the most affordable and most popular childcare option in Northern Ireland, childminding must play a central role in any future childcare strategy. NICMA has submitted modest, cost-effective proposals to various Executive departments aimed at tackling the current shortage of affordable, high quality childcare. Recently, it successfully implemented a pilot rural childminding programme, funded by the Department of Agriculture and Rural Development, which cost a mere £173,000 and is in the process of creating some 400 new childcare places. Childminders have also played an important role in cost-effective early intervention programmes for childcare through childminder participation in the Sure Start 2 Year Old Programme, and through the provision of respite care for vulnerable children in Sure Start areas.
These programmes all demonstrate that childminding can be utilised to help deliver both early intervention and childcare provision in a really cost-effective way – one that helps the economy and helps tackle poverty, while ensuring that the cost to the public purse is minimised. What concerns NICMA is the piecemeal nature of the Executive's current approach to childcare.
The Draft Budget 2011-15 provides a valuable opportunity to make a long overdue commitment to expand and improve childcare provision on a sustainable, long-term basis. We hope the Executive will rise to this very pressing challenge and ensure that this issue is addressed satisfactorily in the final version of its Budget.
NICMA contact details
Bridget Nodder,
Director,
NICMA, 16 – 18 Mill Street
Newtownards
BT23 4LU
Tel: 0871 200 2063
Website: www.nicma.org
NICMA
February 2011
[1] Welsh Assembly Draft Budget 2011-12, November 2010, para 2.23, p.8.
[2] Department for Enterprise and Trade Northern Ireland. Northern Ireland Labour Force Survey figures, Table 2.4a, published 19th January, 2011. The quoted figures are Labour Force Survey estimates, based on the results of the survey. Available at: http://www.detini.gov.uk/lfs_2.4a_sn10-2.xls The full Labour Force Survey statistics are available at: http://www.detini.gov.uk/deti-stats-index/stats-surveys.htm
[3] We are informed by Save the Children that the phrase 'per child' refers to children aged 0-4 years in the report cited.
[4] DETI, op. cit.
[5] HM Treasury Spending Review 2010, October 2010, p. 68.
[6] Department of Employment and Learning Report of the Taskforce on Employability and Long-term Unemployment. December 2002, p. 94. Available at: http://www.delni.gov.uk/taskforce_report_v.pdf
[7] Waldfogel, Jane and Garnham, Alison (2008) Eradicating child poverty: the role of key policy areas. Childcare and child poverty. (York: Joseph Rowntree Foundation), pp. 3-4. Available at: http://213.253.178.196/cf11_-_daycare_trust_annex_2.pdf
[8] opp. cit., p. 14.
[9] McCartney, Kathleen et al. 'Quality child care supports the achievement of low-income children: Direct and indirect pathways through caregiving and the home environment' in Journal of Applied Developmental Psychology, Vol. 28, Issues 5-6. Sept – Dec 2007, pp. 411 – 426.
[10] See ibid. and Spodek, op. cit.
Summary
1. This paper is concerned with the likely impact of the Spending Review on living standards in Northern Ireland and especially the living standards of those with the lowest incomes. It is written by researchers engaged in a major study of Poverty and Social Exclusion in the UK funded by the Economic and Social Research Council.
2. The commentary is only concerned with the Draft Budget document and does not cover the separate budget statements issued by each Government Department.
3. The cuts in Treasury funding for Northern Ireland are greater than many assume. The consequence of the Spending Review is that by 2014-15 Northern Ireland will be receiving 7.6 per cent less in real terms from the Treasury than it was in 2010-11 to pay for current departmental functions. The real cut in capital funding is 40 per cent and the combined current+capital reduction is 11.3 per cent.
4. The new Office of Budgetary Responsibility (OBR) made three different estimates for public sector inflation during 2010. The Spending Review and the figures in the Draft Budget are based on the OBR's June estimates which were lower than its November estimates. Our paper adjusts the Spending Review and Draft Budget data using the November deflators (the most up-to-date).
5. The Treasury will have cut £530 million from the annual capital budget by 2014-15 and £780 million from current funding. By 2014-15 the Treasury will have withdrawn aggregate funding of £3.48 billion which is more than this year's current expenditure on Education and Justice.
6. Even these figures may be an underestimate. Confusingly, the Draft Budget figures differ from those in the Spending Review. The real cut in capital funding is closer to £550 million and for current funding, £874 million, if we go by the Draft Budget.
7. One of the controversies surrounding the Spending Review concerns the St. Andrews' Agreement and the commitment to the capital investment strategy for 2008-2018 agreed at the resumption of devolved government in 2007. We estimate that there will be a shortfall of £4.5 billion (in cash terms) by 2018. This will seriously undermine the explicit objectives of the strategy, including economic stability, tackling areas of social disadvantage, addressing poverty and promoting tolerance, inclusion, equality and good relations.
8. The emergency June 2010 budget and the Spending review make a number of changes to welfare benefits, adding to those already announced by the previous Government. By 2014-15, spending on benefits across the UK will be £18 billion less than it is now (in cash terms). The loss to Northern Ireland's benefit recipients will be more than £600 million per year by 2014-15.
9. The planned reductions in public spending are not evenly distributed across the Northern Ireland Departments. The UK Government has protected spending on health relative to other areas with the consequence that the current budget of the Department of Health Social Services and Public Safety is increased in cash terms by 7.6 per cent (or £326 million). In real terms, however, DHSSPS spending will be cut by 2.6 per cent over the period of the Spending Review.
10. By 2014-15 all Departments will have substantially lower current budgets in real terms than in 2010-11. The largest cut by volume is to Education (–£268 million), followed by Justice (–£176 million), HSSPS (–£125 million) and Regional Development (–£118 million). Proportionately, the largest cuts are to Regional Development (–20.6%), Culture Arts and Leisure (–17.7%), OFMDFM (–16.8%) and Environment (–15.2%). Two of the biggest departments, Justice and Education lose 13 and 12.7 per cent respectively. The smallest cut is to HSSPS followed by Employment and Learning (–6.8%) and Enterprise, Trade and Investment (–6.8%). By 2014-15, Social Development will be spending 9.1 per cent less than in 2010-11, a cut of £52m.
11. The Executive has sought to offset the worst of the capital budget cuts. Nevertheless, Regional Development, with the biggest capital programme, loses 13.8 per cent by 2014-15. The hardest hit Departments are Social Development (–41.4%) which has the second largest capital programme, Enterprise, Trade and Investment (–39.2%), Culture, Arts and Leisure (–35.9%), and Education (–28.3%).
12. The cuts in public spending are occurring in a context of a stagnant employment rate, rising unemployment and restricted opportunities for younger people. They will cause unemployment through direct job losses, through public agencies purchasing fewer goods and services from the private sector, and through reduced demand in the economy from lower personal incomes. The Draft Budget provides no assessment of job losses.
13. We estimate that the public spending cuts will lead to a loss of 38,000 jobs, half of which will be from the public sector.
14. The redundancies will have a disproportionate impact on women, an affect which is entirely predictable from the structure of the public sector. The Draft Budget makes no attempt to address this, leaving the Executive open to legal challenge for failing to have due regard to equality of opportunity.
15. The job losses and cuts in the value of key benefits will reduce living standards and increase poverty. The Executive's main response is that a new economic strategy is being developed that will 'rebalance' the economy towards the private sector. The Draft Budget has set spending plans for the next four years without agreeing the general shape of the strategy. Consideration should be given to top-slicing Departmental budgets to provide a strategic fund to support agreed goals of sectoral growth, employment growth and reduction in economic hardship.
16. The main debate over economic strategy has been about lowering the rate of Corporation Tax. Our consideration of this issue concludes that to cut the rate to 12.5 per cent would be a poor use of £280 million per annum with little certainty of significant job creation.
17. The Green New Deal provides a model for an integrated economic strategy that has the potential to reduce household energy consumption and costs, to create employment and to reduce Northern Ireland's carbon emissions. The proposed investment in Green New Deal for the next four years is negligible when put alongside the need to reduce fuel poverty and the Executive has yet to articulate a strategy for implementing key elements of Green New Deal. In terms of benefiting the worst off households, interventions need to be appropriately prioritized and targeted.
18. The new economic strategy will need to consider the future role and contribution of the banks, especially the quasi-nationalised banks, to Northern Ireland's economy and employment growth.
19. The most serious impact on living standards in the foreseeable future stems from changes in taxation and welfare benefits. According to the Institute for Fiscal Studies, except for London, households in Northern Ireland are worst off as a result of the changes 3 for two reasons. Northern Ireland has a relatively high proportion of households with children and a higher proportion of household income is sourced from welfare benefits.
20. The tax and benefit reforms result in a cut of 5.5 per cent in household income for the poorest fifth of households and a 3.8 per cent cut for the richest fifth.
21. We propose that the priority for the Budget and subsequent actions is two-fold:
a) to protect the living standards of those at the lower end of household income distribution, and especially the prospects and opportunities for the children in those households;
b) to improve the quality of life in households and communities most affected by the recession.
22. One way to further these aims is in the design of new revenue streams, whether these involve charges, investment funds, rates, or tax varying powers (both tax reliefs and impositions). The implication of this is that revenue raising should either be progressive (with the better-off paying more relative to income) or should have an identifiable social or environmental objective.
23. We make a number of proposals including raising the price of alcohol, selective charging for car use and access, a tax on boat ownership, air passenger charges for local flights (Ireland and Britain, exit and entry), and the introduction of a land value tax.
The 2010 Spending Review and the implications for Northern Ireland
Various claims have been made for the likely consequences of the October 2010 Spending Review for Northern Ireland. Now that the NI Executive has agreed a draft budget for the next four years, there is an opportunity to examine the available data on public spending and assess the impact on departmental programmes and the overall economy. This paper is concerned with the likely impact of the Spending Review on living standards in N. Ireland and especially the living standards of those with the lowest incomes. It is written by researchers engaged in a major study of Poverty and Social Exclusion in the UK funded by the Economic and Social Research Council.[1]
Three sections follow. First we consider the scale and nature of the cuts in public spending. Secondly we estimate the impact on employment and unemployment. Finally, we comment on the Northern Ireland Executive's priorities in the wake of the UK Government's deficit reduction measures.
1. Public Expenditure Reduction
When the UK Chancellor George Osborne published the Spending Review[2] there were two main political reactions in Northern Ireland. The first was that the UK Government had reneged on commitments agreed with the previous administration regarding the political way forward for Northern Ireland. Following the St Andrews Agreement, there was an £18 billion commitment to capital investment and there are fears that this has been lost during the change of Government and the devolution of responsibility for the administration of justice. This is a very important issue as can be seen from the investment plans described in the 2008-2018 strategy document.[3] The second reaction was that the cuts were worse than expected. Northern Ireland's Finance Minister Sammy Wilson spoke of a reduction of "£4 billion in real terms across the Spending Review period".[4] The Secretary of State for Northern Ireland Owen Patterson was said to be surprised at the depth of negative reaction to the Spending Review, arguing that saving "1.7p in the pound in each of the next four years" was achievable. Northern Ireland was getting "a quite remarkable deal… I don't know what planet they're [NI politicians] living on." The Treasury's figure was a £2 billion cut over the Review period.[5] Adding to the confusion is the Treasury figure of – 6.9% as the cut and the NI Executive's figure of –8%.
These are the political headlines. But what do the figures say? The figures in the Spending Review show that, by 2014/15, Northern Ireland will be receiving 6.9 per cent less than it was in 2010-11 to pay for current departmental functions such as health and education (Table 1). In arriving at this figure, assumptions have to be made about the rate of inflation that is applicable to the public sector, otherwise know as the GDP Deflator, a series maintained by HM Treasury. The assumptions made about public sector inflation are crucial to the calculation of increases or decreases in public spending. For example, according to the Spending Review health spending in England is set to rise by 1.3 per cent. Given that health spending covers almost a third of the UK spending budget, this is a significant commitment requiring steeper cuts in other budgets. Education (about 16% of all spending) will have 3.4 per cent less for the year 2014-15 than it has for 2010-11. Local government in England (just under a tenth of all spending) will have 27 per cent less by 2014-15.
As the House of Commons Health Committee points out, the Department of Health was one of only two departments for which the Government made a commitment to protect funding. The Committee questions whether this has been achieved in the Spending Review. Because of a change in the estimate of the GDP deflator, health is likely to have around £250 million less in 2014-15 than it does now.[6] This is without taking account of the estimated above-inflation 3.9 per cent increase needed for the ageing population and technological innovation, or the costs arising from the proposed reform of the NHS.
Table 1: October 2010 Spending Review allocations to devolved administrations[7]
| Resource funding1 £billions | 2010-11 | 2011-12 | 2012-13 | 2013-14 | 2014-15 | Change to budget by 2014/15 % |
| N Ireland | 9.3 | 9.4 | 9.4 | 9.5 | 9.5 | -6.9 |
| Scotland | 24.8 | 24.8 | 25.1 | 25.3 | 25.4 | -6.8 |
| Wales | 13.3 | 13.3 | 13.3 | 13.5 | 13.5 | -7.5 |
| Capital funding | ||||||
| N Ireland | 1.2 | 0.9 | 0.9 | 0.8 | 0.8 | -37 |
| Scotland | 3.4 | 2.5 | 2.5 | 2.2 | 2.3 | -38 |
| Wales | 1.7 | 1.3 | 1.2 | 1.1 | 1.1 | -41 |
| Resource AME2 | ||||||
| N Ireland3 | 5.5 | 5.8 | 5.2 | 5.1 | 6.2 | |
| Scotland | 0.0 | 0.1 | 0.2 | 0.3 | 0.4 | |
| Wales | -0.1 | -0.1 | -0.1 | -0.1 | -0.1 |
1. Current funding governed by Departmental Expenditure Limits.
2. Annually Managed Expenditure.
3. Figures for N. Ireland include Capital AME (2010-11: 0.3; 2011-12: 0.3; 2012-13: 0.2; 2013-14: 0.1; 2014-15: 0.2.).
How will the revised GDP deflator affect N. Ireland's budget? The impact of assumptions about public sector inflation can be seen in Table 2.
Table 2: Change in Northern Ireland budget by GDP deflator
| 2010-11 | 2011-12 | 2012-13 | 2013-14 | 2014-15 | ||
| 1 | N Ireland resource funding (£bn) | 9.3 | 9.4 | 9.4 | 9.5 | 9.5 |
| 2 | OBR pre-budget GDP deflator | 1.6 | 2.4 | 2.7 | 2.7 | |
| 3 | OBR June 2010 budget GDP deflator1 | 1.9 | 2.3 | 2.6 | 2.7 | |
| 4 | June 2010 index2 | 100 | 101.9 | 104.24 | 106.95 | 109.84 |
| 5 | OBR November 2010-revised GDP deflator | 2.5 | 2.2 | 2.7 | 2.7 | |
| 6 | November index | 100 | 102.5 | 104.76 | 107.59 | 110.49 |
| 7 | Value of 2010-11 resource using June 2010 index | 9.3 | 9.48 | 9.69 | 9.95 | 10.22 |
| 8 | Real change (R1-R7) £bn | 0 | –0.08 | –0.29 | –0.45 | –0.72 |
| 9 | Running total of R8 | 0 | –0.08 | –0.37 | –0.82 | –1.54 |
| 10 | N Ireland capital funding (£bn) | 1.2 | 0.9 | 0.9 | 0.8 | 0.8 |
| 12 | Value of 2010-11 capital using June 2010 index | 1.2 | 1.22 | 1.25 | 1.28 | 1.32 |
| 13 | Real change (R9-R10) £bn | 0 | –0.32 | –0.35 | –0.48 | –0.52 |
| 14 | Running total of R11 | 0 | –0.32 | –0.67 | –1.15 | –1.67 |
1. Percentage increase over previous year
2. Shows the cumulative affect of row 3 with 2010-11 as 100.
Rows 1 and 10 (resource and capital) give the Spending Review cash budget for each year covered by the Review. In 2010, the newly-established Office of Budgetary Responsibility published three different forecasts for the GDP deflator: a) in its pre-budget report (row 2); b) the deflators used in the June 2010 emergency budget statement (row 3); and c) revised estimates published in November (row 5). The Spending Review used the June 2010 deflators and these are shown as an index in row 4, based on 2010-11 as 100. Using this index, row 7 shows what the 2010-11 spend is worth in later years. For example row 12 shows that the £1.2 billion capital spend for 2010-11 would need to be £1.32 billion by 2014-15 in order to keep pace with public sector inflation. But the Spending Review allows for a capital spend that year of only £0.8 billion, a cut of £0.52 billion (£520 million) in real terms, or 39 per cent in that year alone. Similarly, the resource budget for 2014-15 (row 1) is £9.5 billion compared to the £10.2 billion required to keep pace with public sector inflation (row 7), a 6.9% cut from the 2010-11 level of spending. The resource and capital Treasury funding for 2014-15 will be £1.24 billion below what it was in 2010-11: a 10.7 per cent cut.
Based on the GDP deflators used for the Spending Review, a total of £1.54 billion will have been cut from resource spending between 2011-12 and 2014-15 (row 9). Another £1.67 billion will have been cut from capital investment (row 14), bringing the combined cut to £3.21 billion. Using the November revision to the GDP deflator, the reduction in resource funding rises to £780 million for 2014-15 and £530 million is lost from the capital spend – a combined total of £1.31 billion (Table 3). The contrast between the June and November deflators is shown in Table 4.
Table 3: Revised estimates of change to Treasury funding for N. Ireland
| 2010-11 | 2011-12 | 2012-13 | 2013-14 | 2014-15 | ||
| 1 | N Ireland resource funding (£bn) | 9.3 | 9.4 | 9.4 | 9.5 | 9.5 |
| 2 | OBR November 2010-revised GDP deflator | 2.5 | 2.2 | 2.7 | 2.7 | |
| 3 | November index | 100 | 102.5 | 104.76 | 107.59 | 110.49 |
| 4 | Value of 2010-11 resource using November 2010 index | 9.3 | 9.53 | 9.74 | 10.01 | 10.28 |
| 5 | Real change (R1-R4) £bn | 0 | –0.13 | –0.34 | –0.51 | –0.78 |
| 6 | Running total of R5 | 0 | –0.13 | –0.47 | –0.98 | –1.76 |
| 7 | N Ireland capital funding (£bn) | 1.2 | 0.9 | 0.9 | 0.8 | 0.8 |
| 8 | Value of 2010-11 capital using November 2010 index | 1.2 | 1.23 | 1.26 | 1.29 | 1.33 |
| 9 | Real change (R9-R10) £bn | 0 | –0.33 | –0.37 | –0.49 | –0.53 |
| 10 | Running total of R9 | 0 | –0.33 | –0.70 | –1.19 | –1.72 |
Table 4: Comparison of losses in Treasury funding using different GDP deflators
| Losses to 2014-15 budget | £ million | Percentage change | ||
| GDP deflator | June | November | June | November |
| Resource | –720 | –780 | –6.9 | –7.6 |
| Capital | –520 | –530 | –39 | –40 |
| Resource+capital | –1,240 | –1,310 | –10.7 | –11.3 |
| Aggregate losses 2011-12 to 2014-15 | ||||
| Resource | –1,540 | –1,760 | ||
| Capital | –1,670 | –1,720 | ||
| Resource+capital | –3,210 | –3,480 | ||
We are now in a position to assess the headline claims surrounding the Spending Review. It appears that neither the Secretary of State for Northern Ireland's "1.7p in the pound" nor the Finance Minister's £4 billion cut are borne out by the above figures. The 1.7p figure comes from dividing the 6.9 per cent cumulative cut to the 2014-15 resource budget Table 1, row 1) into four equal parts (1.72). But this is not how the cuts are projected by HM Treasury. In the first year they are projected to be less than one per cent, in year two, three per cent and in year four, 4.5 per cent before reaching 6.9 per cent in the final year. And this only covers the current resource element, as well as being based on the now outof-date June 2010 GDP deflators. The capital cut for the next financial year (2011-12) is 27 per cent of budget, or £330 million. Combining capital and current resource budgets, £460 million will be lost – a 4.3 per cent cut for next year.
It is not clear where the claims of £4bn or £2bn in cuts come from. By 2014-15, Treasury based funding (resource + capital) will be £1.3bn (or 11.3 per cent) less than 2010-11. By the end of 2014-15, an aggregate loss of £3.48bn to N. Ireland's Treasury funding will have occurred (Table 4). The loss of Treasury funding may be considerably more than this as the Spending Review figures are expressed in billions and rounded to the nearest 100 million. Using the more detailed figures contained in the N. Ireland's Draft Budget (Table 4a) the estimated cut in Treasury capital funding is £1,855 million.
Table 4a: Reduction in Treasury capital funding for N. Ireland, Draft Budget data
| £ million | 2010-11 | 2011-12 | 2012-13 | 2013-14 | 2014-15 |
| N Ireland capital funding (£bn) | 1,222.9 | 903.4 | 858.9 | 780.6 | 803.8 |
| Value of 2010-11 funding | |||||
| using November 2010 index | 1,222.9 | 1,253.5 | 1,281.1 | 1,315.7 | 1,351.2 |
| Real change | 0 | –350.1 | –422.2 | -–535.1 | –547.4 |
| Cumulative change | –350.1 | –772.3 | –1,307.4 | –1,854.8 |
A major concern is how the cuts in capital funding affect the plans outlined in The Investment Strategy for Northern Ireland 2008-2018. Between 2011-12 and 2017-18 the planned investment was £11,692 million. Up to 2014-15 the Treasury will fund £3,347 million, leaving a shortfall of £8,345 million. If we assume that £200 million per year will come from the Reinvestment and Reform Initiative over the entire seven year period, the shortfall is £6,945 million. For the three years outside the Spending Review period, Treasury funding will need to be £2,315 million each year in cash terms, almost three times the 2014-15 level. This is highly improbable and the likely scenario is that the Investment Strategy will be £4.5 billion short by the end of 2017-18 (cash terms only).
The 2008-2018 Investment Strategy followed the resumption of devolved government in 2007 and expressed both optimism and ambition. It was clearly seen as a peace-building plan involving economic, social and environmental goals. The package was designed to address the lack of investment in N. Ireland's infrastructure over many decades and the social goals of promoting 'tolerance, inclusion, equality of opportunity and the desirability of good relations', promoting 'regional balance in future development' and tackling areas of social disadvantage. The explicit aim was to procure capital projects in order to, maximise the social and employment opportunities for all our people, addressing existing patterns of socioeconomic disadvantage and using prosperity to tackle poverty.[8]
The status of the Investment Strategy vis-à-vis the St. Andrews' Agreement has been much debated. Paragraph 9 of the Agreement states, 'The Governments are also committed to working with the parties to establish the most favourable possible financial climate for a newly restored Executive'. Annex B to the Agreement committed the Government to publishing 'an Anti-Poverty and Social Exclusion strategy to tackle deprivation in both rural and urban communities based on objective need and to remedy patterns of deprivation', which would thereafter be taken forward by the Executive. Annex C is titled 'Financial Package for the Newly Restored Executive'. The key text says,
The Governments are committed to working with all the parties to establish a platform for long-term economic stability and reform necessary for a newly restored Executive. In the context of restoration of the institutions, the Governments remain committed to ensuring the Executive has the capacity to provide quality public services, to continue the process of necessary reform, to plan for the future, to make the long-term capital investments to underpin the economic transformation of Northern Ireland, as well as bringing long-term benefits for the island as a whole.[9]
These commitments, albeit unquantified in the Agreement itself, were an intrinsic part of securing and strengthening political trust between all the political parties and the British and Irish Governments after decades of violent conflict. In this context, the idea that the Spending Review equates with 'long-term economic stability' attracts cynicism and the ability of the Executive to sustain a long-term investment programme to transform N.Ireland is undoubtedly compromised. The Treasury's cuts to the Northern Ireland budget are, therefore, not only fraught with economic consequences, they carry social and political consequences as well. For the political parties and the Executive, the cuts amount to a breach of trust in peacebuilding. Many local communities will be undermined and destabilized by the disinvestment in services and projects. Individuals and families face futures of unemployment and economic insecurity. These are the risks that are being taken with N. Ireland's peaceful future.
Unlike the other devolved administrations, Northern Ireland's social security benefit costs comprise the main element of the AME allocation in Table 1.[10] The Treasury provides no estimate for real changes in this budget as elements of it are demand-led (e.g. the costs of unemployment and health-related benefits, and pensions) and subject to fluctuations in inflation. However, the emergency June 2010 Budget and the Spending Review together make cuts to welfare benefits such that by 2014-15, benefits spending will be £18 billion lower than had the measures (such as changing the indexing of benefits) not been implemented. As we shall see, the impact of the benefit changes by 2014-15 will fall disproportionately on Northern Ireland, but assuming the £18bn is shared proportionately and in line with the 2009-10 outturn for social protection spending, £612 million will be cut from the 2014-15 welfare benefits budget, with lesser sums in the preceding years, amounting to an estimated aggregate loss of £1.2bn. Coupled to the aggregate loss identified above, N. Ireland stands to lose £4.81 billion of Treasury funding between now and the end of 2014-15. In summary, total Treasury-based support for public expenditure in N. Ireland for 2014-15 will be £1.31bn less in real terms than in 2010-11 and a further £612m (in cash terms) will have been directly removed from pensioners, the unemployed and others with no paid employment.
The N. Ireland Draft Budget (published 15 December 2010) provides a broad outline of departmental budgets for the planning period. At first sight, the figures bear little resemblance to the Treasury planning figures (Table 1 above). This is for a number of reasons, the main one being that the Executive is able to off-set the withdrawal of Treasury funding to some extent by raising funds through the rates, the sale of public assets and the introduction of charges. In particular, the Executive has chosen to moderate the Treasury cuts in capital funding. Another reason for the lack of correspondence between the Spending Review data and N. Ireland's Draft Budget is because of the exclusion/inclusion of 'depreciation'. The adoption of International Financial Reporting Standards (mandatory for all government bodies from March 2010) requires that the cost of assets depreciating over their lifetime is written into annual accounts. Table 5 shows the difference depreciation makes to the N. Ireland resource account. There is still a discrepancy in the 2010-11 spending figures as between the Spending Review (Table 5, row 2) and N. Ireland Draft Budget (row 3). The probable explanation lies in a footnote to the Treasury figures that refers to the timing of the cuts.[11]
Table 5: N. Ireland Draft Budget, resource funding and depreciation
| 2010-11 | 2011-12 | 2012-13 | 2013-14 | 2014-15 | ||
| 1 | Resource (excluding depreciation)1 | 9.3 | 9.4 | 9.4 | 9.5 | 9.5 |
| 2 | Resource (including depreciation)1 | 9.6 | 9.8 | 9.8 | 9.8 | 9.9 |
| 3 | NI Draft Budget2 | 9.8867 | 9.8367 | 9.8589 | 9.9271 | 9.9854 |
| 4 | Value of 2010-11 resource (row 3) using June 2010 index | 9.8867 | 10.07858 | 10.3059 | 10.5738 | 10.85955 |
| 5 | Real change (R3–R4) £bn | 0 | –0.24188 | –0.4470 | –0.6467 | –0.87415 |
| 6 | Percentage change | –2.4 | –4.3 | –6.1 | –8.0 |
1. October 2010 Spending Review
2. Draft Budget 2011-15, 15th October 2010
Before moving on to the Departmental allocations in the Draft Budget, the headline figures for resource and capital spending are modelled using the November GDP deflators (Table 6). This provides a new estimate of the real losses to public spending by the NI Executive, moderating the Treasury cuts to N. Ireland summarised in Table 4. Next year (2011-12) sees a 5.5 per cent cut in resource and capital spending by the Executive. The cut rises to 10.1 per cent by 2013-14 and is planned to be 9.6 per cent in the final year. By 2014-15 the aggregate loss amounts to £4.0bn. Cuts in welfare benefits bring the total aggregate loss to an estimated £5.2bn. All of these figures refer to real change compared to 2010-11 spending.
Table 6: N. Ireland Draft Budget, estimates of change over planning period
| Resource | 2010-11 | 2011-12 | 2012-13 | 2013-14 | 2014-15 | |
| 1 | NI Draft Budget resource (£bn) | 9.8867 | 9.8367 | 9.8589 | 9.9271 | 9.9854 |
| 2 | Value of 2010-11 resource using November 2010 index (£bn) | 9.8867 | 10.1339 | 10.3573 | 10.6371 | 10.9238 |
| 3 | Real change (R1–R2) (£bn) | 0 | -0.2972 | -0.4984 | -0.7100 | -0.9384 |
| 4 | Running total of R4 | -0.2972 | -0.7956 | -1.5056 | -2.444 | |
| 5 | Percentage change | –2.93 | –4.81 | –6.67 | –8.59 | |
| Capital | ||||||
| 6 | NI Draft Budget net capital (£bn)1 | 1.4881 | 1.1839 | 1.1249 | 1.0786 | 1.3738 |
| 7 | Value of 2010-11 net capital using November 2010 index (£bn) | 1.4881 | 1.5253 | 1.5589 | 1.6010 | 1.6442 |
| 8 | Real change (R6–R7) (£bn) | 0 | -0.3414 | -0.4340 | -0.5224 | -0.2704 |
| 10 | Running total of R9 | -0.3414 | -0.7754 | -1.2978 | -1.5682 | |
| 11 | Percentage change (R8/R7) | -22.4 | -27.8 | -32.6 | -16.4 | |
| Resource + Capital | ||||||
| 12 | NI Draft Budget resource + capital | 11.3748 | 11.0206 | 10.9838 | 11.0057 | 11.3592 |
| 13 | Value of 2010-11 using November 2010 index | 11.3748 | 11.6592 | 11.9162 | 12.2381 | 12.5680 |
| 14 | Real change (R12–R13) (£bn) | 0 | -0.6386 | -0.9324 | -1.2324 | -1.2088 |
| 15 | Running total of R14 | -0.6386 | -1.5710 | -2.8034 | -4.0122 | |
| 16 | Percentage change | -5.5 | -7.8 | -10.1 | -9.6 |
1. Source: Table 4.2 of Draft Budget 2011-15. Gross capital spending will be about 10% more than this:
+£126m (2011-12), +£113m (2012-13), +£104m (2013-14) and +£104m (2014-15) (in cash terms).
Departmental Budgets
The planned changes in N. Ireland's public spending are not evenly distributed across the Departments. In Table 7 the first line of data for each Department (in order of size of budget) is taken from the Draft Budget. These are cash figures for current spending and the percentages in brackets represent the change on the previous year, making no allowance for inflation. On this basis it appears for example that HSSPS current spending increases in every year and is £326.3 million ahead of the 2010-11 level by 2015-15, an increase of 7.6% over the planning period. The second line of data for each Department shows the change in real terms from 2010-11 funding, based on the latest estimates of GDP deflators published by the Office for Budgetary Responsibility. On this basis, DHSSPS has a cut of £62.4m for 2011-12 and £80m for 2012-13. Over the entire period, we estimate that DHSSPS loses an aggregate of £353.8m in funding and that by 2014-15, funding is 2.6 per cent below 2010-11 levels in real terms.
The largest cut to 2014-15 budgets by volume is to Education (–£268m), followed by Justice (–£176m), HSSPS (–£125m) and Regional Development (–£118m). Proportionately, the largest cuts are to Regional Development (–20.6%), Culture Arts and Leisure (–17.7%), OFMDFM (–16.8%) and Environment (–15.2%). Two of the biggest departments, Justice and Education lose 13 and 12.7 per cent respectively. As we have seen, the smallest cut is to HSSPS followed by Employment and Learning (–6.8%) and Enterprise, Trade and Investment (–6.8%). By 2014-15, Social Development will be spending 9.1 per cent less than in 2010-11, a cut of £52m.
Regarding capital spending plans, Table 4 shows the Treasury's radical reduction in support for N. Ireland's capital programmes – the allocation is 40 per cent below the 2010-11 level by 2014-15 and an aggregate of £1.85 billion will have been cut from the Treasury's support of capital spending (Table 4a). The Draft Budget addresses these losses in a number of ways. First, £200 million per year is to be borrowed under the Reinvestment and Reform Initiative. This is the maximum allowed by the Treasury and it compensates for more than half the £350 million cut in Treasury capital funding for 2011- 12 (Table 4a). A further £80.5 million will come from various sources including the Irish Government (£14 million), from switching current expenditure to the capital programme and an under-spend (£23 million, mainly by NI Water) on the 2010-11 budget. The Draft Budget also includes assumptions about capital receipts – a total of £547 million (in cash terms) is expected to be raised in this way over the planning period. The Draft Budget reduces net capital spending in cash terms for the first three years and increases it by more than a quarter in the final year. Table 8 estimates the real changes in net capital budgets across Departments for the whole planning period (ranked by size of capital budget). The last two columns quantify the reductions in aggregate net capital spending plans. The change is in terms of what spending would have been over the whole period had it remained at 2010-11 levels. Regional Development, with the biggest capital programme, loses £402m (a cut of 13.8%). The hardest hit Departments (excluding Agriculture and Rural Development, and Environment which have anomalous 2010-11 baselines) are Social Development (–41.4%) which is the second largest programme, Enterprise, Trade and Investment (–39.2%), Culture, Arts and Leisure (–35.9%), and Education (–28.3%). The 35% cut in annual net capital spending on Justice is reversed sharply in the final year, softening the overall cut to £64m (–15.2%).
Table 7: Real change in Departmental and other current expenditure
| £ million | 2010-11 | 2011-12 | 2012-13 | 2013-14 | 2014-15 |
| Health, Social Services and Public Safety | 4,302.9 | 4,348.1 (+1.0%) | 4,427.7 (+1.8%) | 4,543.2 (+2.6%) | 4,629.2 (+1.9%) |
| Real change from 2010-11 budget | 0.0 | –62.4 (–1.4%) | –80.0 (–1.8%) | –86.3 (–1.9%) | –125.1 (–2.6%) |
| Education | 1,914.8 | 1,852.2 (–3.3%) | 1,857.3 (+0.3%) | 1,861.6 (+0.2%) | 1,847.7 (–0.7%) |
| Real change from 2010-11 budget | 0.0 | -110.5 (–5.6%) | -148.6 (–7.6%) | -198.5 (–9.6%) | -268 (–12.7%) |
| Justice | 1,223.7 | 1,213.1 (–0.9%) | 1,189.0 (–2.0%) | 1,166.7 (–1.9%) | 1,176.4 (+0.8%) |
| Real change from 2010-11 budget | 0.0 | –41.2 (–3.3%) | –92.9 (–7.2%) | –149.9 (–11.4%) | –175.7 (–13.0%) |
| Employment and Learning | 798.9 | 775.4 (–2.9%) | 767.4 (–1.0%) | 785.6 (+2.4%) | 813.8 (+3.6%) |
| Real change from 2010-11 budget | 0.0 | –34.2 (–4.2%) | –60.1 (–7.3%) | –64.3 (–7.6%) | –59 (–6.8%) |
| Social Development | 521.1 | 516.7 (–0.8%) | 532.0 (+3.0%) | 543.0 (+2.1%) | 523.4 (-3.6%) |
| Real change from 2010-11 budget | 0.0 | –17.4 (–3.3%) | –13.9 (–2.5) | –17.7 (–3.2) | –52.4 (–9.1) |
| Regional Development | 517.3 | 500.3 (-3.3%) | 487.2 (-2.6%) | 459.6 (–5.7%) | 454.0 (-1.2%) |
| Real change from 2010-11 budget | 0.0 | –29.9 (–5.6%) | –54.7 (–10.1) | –97.0 (–17.4) | –117.6 (–20.6) |
| Agriculture and Rural Development | 224.9 | 224.9 (0.0%) | 236.0 (+4.9%) | 222.6 (–5.7%) | 219.0 (–1.6%) |
| Real change from 2010-11 budget | 0.0 | –5.6 (–2.4%) | +0.4 (+0.2%) | –19.4 (–8.0%) | –29.5 (–11.9%) |
| Enterprise, Trade and Investment | 199.5 | 204.9 (+2.7% ) | 211.6 (+3.2%) | 203.5 (–3.8%) | 205.5 (+1.0%) |
| Real change from 2010-11 budget | 0.0 | +0.4 (+0.2%) | +2.6 (+1.2%) | –11.1 (–5.2%) | –14.9 (–6.8%) |
| Finance and Personnel | 182.9 | 190.5 (+4.2%) | 187.1 (–1.8%) | 179.9 (–3.9%) | 180.9 (+0.5%) |
| Real change from 2010-11 budget | 0.0 | –4.8 (–2.5%) | –4.5 (–2.3%) | –16.9 (–8.6%) | –21.2 (–10.5%) |
| Environment | 129.6 | 121.8 (–6.0%) | 123.6 (+1.4%) | 121.0 (–2.1%) | 121.5 (+0.4%) |
| Real change from 2010-11 budget | 0.0 | –11.0 (–8.3%) | –12.2 (–9.0%) | –18.4 (–13.2%) | –21.7 (–15.2%) |
| Culture, Arts and Leisure | 113.3 | 112.5 (0.7%) | 113.2 (+0.6%) | 110.0 (–2.9%) | 103.0 (–6.3% ) |
| Real change from 2010-11 budget | –3.6 (–3.1%) | –5.5 (–4.6%) | –11.9 (–9.8%) | -22.2 (–17.7%) | |
| Office of the First Minister and Deputy First Minister | 80.2 | 79.0 (–1.4%) | 80.2 (+1.6%) | 77.0 (–4.1%) | 73.7 (–4.3%) |
| Real change from 2010-11 budget | –3.2 (–3.9%) | –3.8 (–4.5%) | –9.3 (–10.8%) | –14.9 (–16.8%) | |
| Non-Ministerial Departments | |||||
| NI Assembly | 48.4 | 46.0 (–5.0%) | 43.7 (–5.0%) | 41.5 (–5.0%) | 39.4 (–5.0%) |
| Real change from 2010-11 budget | 0.0 | –3.6 (–7.3%) | –7.0 (–13.8%) | –10.6 (–20.3%) | –14.1 (–26.4%) |
| Public Prosecution Service | 37.4 | 37.0 (–1.0%) | 36.0 (–2.6%) | 35.2 (–2.3%) | 33.9 (–3.6%) |
| Real change from 2010-11 budget | 0.0 | –1.3 (–3.4%) | –3.2 (–8.1%) | –5.0 (–12.5%) | –7.4 (–18.0%) |
| Other1 | 21.2 | 20.5 | 20.0 | 19.5 | 19.0 |
| Real change from 2010-11 budget | 0.0 | –1.2 (–5.7%) | –2.2 (–10.0%) | –3.3 (–14.5%) | –4.4 (–18.9%) |
1. Includes Assembly Ombudsman/Commissioner for Complaints, Food Standards Agency, NI Audit Office and NI Office for Utility Regulation.
Table 8: Real change in capital spending 2010-11 to 2014-15
| Net Capital planned expenditure £millions | 2010-11 | 2011-12 | 2012-13 | 2013-14 | 2014-15 | Real change in 2010-11 to 2014-15 aggregate | % real change |
| Regional Development | 556.2 | 438.3 | 425.3 | 540.9 | 558.8 | -402.4 | -13.8 |
| Social Development | 269.6 | 150.3 | 120.6 | 99.0 | 190.3 | -586.5 | -41.4 |
| Health, Social Services and Public Safety | 201.7 | 214.8 | 278.8 | 184.9 | 163.3 | -16.1 | -1.5 |
| Environment | 182.4 | 6.1 | 5.9 | 4.0 | 7.6 | -752.2 | -78.5 |
| Education | 169.3 | 127.4 | 100.4 | 101.5 | 139.4 | -251.4 | -28.3 |
| Justice | 80.0 | 78.3 | 64.5 | 51.8 | 82.0 | -63.7 | -15.2 |
| Enterprise, Trade and Investment | 73.5 | 71.7 | 44.9 | 16.0 | 28.8 | -151.2 | -39.2 |
| Culture, Arts and Leisure | 59.9 | 11.8 | 21.9 | 22.2 | 85.8 | -113.1 | -35.9 |
| Employment and Learning | 37.6 | 41.2 | 32.3 | 18.5 | 28.3 | -39.6 | -20.1 |
| Finance and Personnel | 15.2 | 16.5 | 12.1 | 10.6 | 28.4 | 2.9 | 3.7 |
| Office of the First Minister and Deputy First Minister | 12.0 | 9.1 | 3.8 | 8.8 | 25.6 | -3.7 | -5.9 |
| Agriculture and Rural Development | -173.5 | 16.4 | 13.9 | 20.0 | 29.3 | 817.6 | -89.7 |
| Non Ministerial Departments | 4.3 | 1.9 | 0.4 | 0.6 | 6.2 | -9.2 | -40.7 |
| Total Net Capital • | 1,488.1 | 1,183.9 | 1,124.9 | 1,078.6 | 1,373.8 | -1,568.3 | -20.1 |
Given the delays in publishing the spending plans of individual Departments, no attempt has been made to take the analysis to sub-Departmental level. We note, however, the significant discrepancies between the Draft Budget current and capital allocations and the plans of some Departments (for example, Justice).
2. Impact on Employment
The Draft Budget acknowledges that the Spending Review 'will have significant negative consequences for economic growth and employment', given the economy's reliance on the public sector, but provides no estimate of job losses. Historically, N. Ireland has had a low employment rate, lower than any region in Great Britain. Prior to the onset of the 2007 recession, the employment rate reached a high of 69.3 per cent. By the autumn of 2009 it had fallen to 65.4 per cent. For the latest quarter (September to November 2010) the employment rate remains a stubborn 65.3 per cent.[12] Prior to the recession, unemployment (Labour Force Survey measure) in Northern Ireland was below the UK average. While this remains the case, LFS unemployment in Northern Ireland continues to rise, unlike most areas in Great Britain. N. Ireland's unemployed claimant count rose by 8.5 per cent in the year to the August-October 2010 quarter compared to a 10 per cent decrease across Great Britain. Almost half the unemployed (48%) in N. Ireland have now been out of work for more than a year and the unemployment rate for 18-24 year olds is 21 per cent. Therefore the cuts in public spending are occurring in a context of a stagnant employment rate, rising unemployment and restricted opportunities for younger people.
Almost a third (31.6%) of employee jobs are in the public sector in N. Ireland and this is the highest proportion for anywhere in the UK. Half of the 220,000 public sector workers are classified as 'central government' which currently includes those working for the Health Service. Local councils employ 65,000 people. Two-thirds of all public sector workers are women and the public sector accounts for 40 per cent of female employment, compared to 23 per cent of male employment. Four-fifths (79%) of local council employees are women. In terms of community background, 46 percent of public sector employees are Catholic and 54 per cent Protestant.[13]
Most of the increase in employment that occurred between 1998 and 2008 was in low paid part-time employment in the service sector[14]. This sector has been severely affected by the recession: the service sector accounts for 72 per cent of total private sector employment and for the first time since 2002, the private sector is decreasing in size.[15] This situation is forecast to worsen as the decline in public spending takes effect.[16] In assessing the impact of the Draft Budget on employment, three factors need to be considered. First, there will be direct job losses as it will not be possible to reduce spending on the required scale without reducing the number of public sector employees. In two of the largest spending areas, HSSPS and Education, the pay bill is about 60 per cent of current spending (about 58% for Health and 62% for Education). In some of the agencies that come under Justice, the pay bill is considerably higher (e.g. the Prison Service). The second consideration is that with lower budgets, public sector organisations purchase less goods and services from the private sector. The reductions in capital spending are particularly damaging in this respect and will mean even less employment in the construction sector which has already seen a 28 per cent decline in employee jobs since December 2007. (Self-employment in construction and production has declined by one-fifth in the last four years.) Thirdly, the reduction in people's disposable income and spending, either because they are being taxed more, have lost work or have less income from benefits, will reduce demand in the economy with particular impacts on local shops and services. For all these reasons, the public sector is estimated to be responsible for around 70 per cent of N. Ireland's GDP.
In previous UK recessions the public sector has tended to protect regions with declining industries and weak private sectors. On this occasion, argues the Work Foundation, the private sector is unlikely to contribute sufficiently to employment growth. This is because the strategy of many businesses during the latest recession has been to avoid redundancies by keeping staff on shorter hours and through pay cuts. There is therefore considerable employee capacity to draw on in any economic upturn, avoiding the need to recruit new staff. A further factor limiting employment growth in the private sector is the reluctance of banks to invest in local productive activity. Over the last ten years, only 3 per cent of all UK bank lending has gone to manufacturing.[17] With disinvestment in the public sector on the current scale, there is less prospect of private sector employment expanding as the UK economy – now officially out of recession – grows.
Regions with higher levels of public sector employment are unlikely to experience significant employment growth as the economy expands. Assuming the UK economy grows in line with the Government's expectations, London and the South East will experience employment growth. However, 'labour markets in the North of England, Wales, and Scotland are likely to perform poorly during any recovery' (N. Ireland is not included in the analysis). Overall, 'the labour market in much of the country is likely to remain in very poor shape'.[18]
This conclusion is supported by PricewaterhouseCooper's sectoral and regional analysis of the Spending Review (which does include N. Ireland).19[19] Initially the Office of Budgetary Responsibility estimated that 490,000 public sector jobs would be lost by 2014-15 and 600,000 by 2015-16. In November it revised the estimate downwards to 330,000 (2014-15) and 'just over 400,000 between 2010-11 and 2015-16'.20[20] The PwC analysis uses the first set of estimates.
According to the PwC analysis, N. Ireland will lose 5.2 per cent of all jobs by 2014-15: an estimated total loss of 36,000 jobs. This compares to 4.3 per cent in Wales and 4.1 per cent in Scotland. About 18,000 are direct losses from the public sector and the remainder arise from the reduction in demand for goods and services and from reduced consumer spending. Private sector employment will need to grow by one per cent each year in order to compensate.
The PwC estimate of public sector job losses is based on distributing the OBR 490,000 job loss according to the share of jobs in each place – 3.6 per cent for N. Ireland, 5.5 per cent for Wales and 9.7 per cent for Scotland. It makes no allowance for differences in the structure of public sector employment from place to place, or, for example, for differences in average public sector pay. (Scotland has the highest average public sector pay of anywhere in GB outside of London). Given the revised OBR figure of 330,000 job losses, the estimate for N. Ireland would need to come down to 12,000 (rather than 18,000). Such a reduced figure, however, is not credible given the cuts to be made to current spending outlined in the Executive's current spending plans (Table 7). By 2014-15, the Executive will be spending £948 million less in real terms than in 2010-11. Using a conservative assumption that 58 per cent of this resource is spent of employment, some £550m will be covered by job losses. Assuming an even distribution across the public sector workforce, one-third of this will impact on men (£183m) and two-thirds on women (£367m). The average public sector wage in Northern Ireland is £24,383, £30,031 for men and £21,066 for women, to which must be added the costs to employers (such as National Insurance, pensions, training) of approximately 25 per cent.[21] On this basis, the cuts in current expenditure will mean 13,954 less jobs (public sector) for women and 4,880 less jobs for men by 2014-15: a total of 18,834 jobs lost. In addition approximately 12,250 jobs will be lost through indirect affects on the private sector and a further 6,600 through the affect of lost consumption – a total loss across public and private sectors of just under 38,000 jobs.
The Draft Budget is to be subject to 'a strategic level Equality Impact Assessment', the timing and consequences of which are unclear. It is immediately apparent that the Budget cuts will have a disproportionate affect on women but there is no attempt to get to grips with this. The Executive would therefore appear to be open to legal challenge for failing to have due regard to equality of opportunity.[22]
3. Impact on living standards
The loss of jobs as a consequence of Treasury reductions in funding to N. Ireland will have the immediate impact of reducing living standards for those affected. As yet, the Executive has not developed a strategy to reverse these affects so N. Ireland must live with reduced living standards and a higher rate of poverty. Compounding the job losses are major cuts in the value of key benefits to those who do not receive an income from paid work for whatever reason. These changes will also reduce living standards and increase poverty. While the Executive has limited powers to raise revenue and to tackle the decline in living standards, a number of proposals are under discussion and a Ministerial Budget Review Group has been established to come up with revenue raising ideas. No principles or priorities appear to have been agreed to guide the work of this group.
The main hope for raising living standards lies with the new economic strategy being developed by the Executive which the Draft Budget outlines as follows:[23]
The challenge for the Northern Ireland Executive (…) is to both rebuild the economy in the aftermath of the recession and to rebalance it towards the private sector in the context of the constrained public expenditure position.
The strategy for achieving this will not be agreed until the Executive has considered a UK Government paper on 'rebalancing' the Northern Ireland economy, the central issue of which is the proposal to reduce the rate of corporation tax, a proposal rejected by the Varney Report in the following terms:
[A] clear and unambiguous case for a 12.5 per cent rate of corporation tax cannot be made. It is clear from this initial assessment that there would be an up-front cost of near £300 million per annum in lost corporation tax receipts, with no cost recovery in terms of tax receipts in a reasonable period of time.[24]
Yet lobbying on the issue continues, partly fuelled by the assumed attractions of tax varying powers and partly by a group of economists and business leaders centred on the Northern Ireland Economic Reform Group.[25] The CBI regards the proposal as 'transformational'.[26]
The Economic Reform Group describes Ireland as 'one of the world's best performing economies' and attributes this to a long-term policy of tax cuts and 'economic freedom', and certainly GDP has grown impressively. But as Stiglitz et al argue, an excessive focus on GDP as a measure of success is no longer tenable and sustainable, either in terms of economic and social progress, or the environment.[27] A simple illustration of this in the case of Ireland is that GDP growth does not always translate into corresponding improvements in living standards (Figure 1).
Figure 1: National disposable income as a proportion of GDP
Source: Stiglitz, J., Sen, A. and Fitoussi, J-P. (2009) Report by the Commission on the Measurement of Economic Performance and Social Progress. p. 25.
Not all opinion is lining up behind the Economic Reform Group: there are some cautionary voices as well as outright opposition. Much in keeping with the Varney Report, a PricewaterhouseCoopers' report concludes:
While a competitive level of Corporation Tax is desirable to ensure UK competitiveness, in our research for this paper we could not find any clear evidence of a simple correlation between low Corporation tax per se and high levels of FDI [foreign direct investment].[28]
PwC estimate that a reduction of the rate of Corporation tax to 12.5 per cent would now cost £278 million p.a. in lost revenue. The Treasury would remove this amount from the Block Grant. Whatever can be said about the long-term prospects of benefits to the N.Ireland economy from a reduction in Corporation Tax, in the short-term a significant resource would be removed from the public sector to the benefit of shareholders in the few public companies registered in N. Ireland that pay the full rate of Corporation Tax. N.Ireland's economy can ill-afford to lose this resource and the 8,000 jobs that are likely to be lost initially. This is one of the arguments put forward in a paper rejecting the Corporation Tax proposal.[29] But the main one is that N. Ireland should not try to compete with the Irish Republic's regime of corporate taxation and governance, a regime which facilitates tax avoidance,[30] encourages 'brass plating' and provides a gateway to tax havens:
The Republic […] has no controlled foreign company laws or thin capitalisation rules, a relaxed approach to the taxing of foreign dividends and to transfer pricing regulation, relatively easily achieved corporate secrecy and (perhaps crucially) membership of the Euro to add to its appeal.[31]
Corporation Tax in this context is a relatively minor consideration. Where it becomes a major problem is in affecting trade between N. Ireland and Britain if differential rates were applied. To prevent companies falsely pricing goods as a means of transferring profits into a lower tax regime, the Treasury would require the application of transfer pricing rules which, argues Murphy, would place an added administrative barrier for the distribution of goods between Britain and N. Ireland:
No supermarket would ever again be able to transfer baked beans from its warehouse in Scotland to its supermarkets in Northern Ireland without having established a procedure to set an arm's length price for the transaction, which is no straightforward matter. The resulting cost for UK business would be considerable.[32]
Even if the EU legal hurdles can be overcome, a Corporation Tax rate of 12.5 per cent for N. Ireland would appear to be a poor use of £280 million per annum. In the short-term jobs would be lost and there is no certainty of job creation.[33] This is not to argue that the Executive should not pursue all possibilities for revenue raising including tax varying powers, but to make the point that better strategic use can be made of such a resource in growing the type of private sector activity which will be of long term benefit to N. Ireland.
The Executive has set Departmental allocations for the next four years before agreeing and adopting a new economic strategy. If key Departments are to support a strategic approach to business development and private sector employment growth, there needs to be flexibility in current and capital allocations. No such strategic private sector employment growth funding is earmarked in the Draft Budget.
The new economic strategy will need to consider the role of the banks operating in N. Ireland which have been substantially affected by the UK and Irish banking crises. The Ulster bank is part of the Royal Bank of Scotland group which is now 84 per cent owned by HM Treasury. The Allied Irish Bank and the Bank of Ireland received around €7 billions of support from the Irish Government in 2009 which in the case of AIB was not sufficient to stave off the bank's rescue by the Irish Government in 2010 (AIB is now 90% owned by the Irish Government). Only the Northern Bank (owned by Danske Bank since 2005) has remained relatively unscathed from the banking crisis. While some initial work has been done on the role of the banks in N. Ireland,[34] it remains unclear what the banks, in particular the quasi-nationalised British and Irish banks, are actually contributing to Northern Ireland's economy.
In many respects, the Executive is constrained by the consequences of the application of the Barnett formula. If the UK Government decides to increase funding for Health then the consequence for N. Ireland's Block Grant is to increase Health funding for comparative areas. Likewise, a decision to cut Higher Education funding for England will result in a cut for N. Ireland. This does not prevent the Executive making strategic decisions to re-shape the Treasury allocations and in departing from aspects of UK Government economic and social policy, though it makes it much more difficult. The Draft Budget makes no such departures and appears to mirror Treasury allocations so that, for example, the 'health' element of the DHSSPS allocation is 'protected' but personal social services and public safety are not.[35] The Draft Budget does, however, set aside £20 million for a Social Investment Fund, under the control of OFMDFM, to address disadvantage 'in those interface communities where the problems are many and complex'. Similarly a £20 million Social Protection Fund has been established to 'assist those most in need within our wider community'. There is no indication as to how this might be targeted but given the legal obligations to address child poverty, the children worst affected by benefit cuts are an obvious priority.
The Draft Budget states that the Executive 'has agreed in principle' to engage with the Green New Deal. The potential of this to reduce household energy consumption and costs, to create employment and to reduce N. Ireland's carbon emissions is widely accepted. While £4 million is in the budget each year for the next four years, the Executive has yet to articulate a strategy for implementing key elements of Green New Deal. In terms of benefiting the worst off households, interventions need to be appropriately prioritized and targeted.
The most serious impact on living standards in the foreseeable future stems from changes in taxation and welfare benefits. Some of these changes were commitments made by the previous government and the Coalition Government has more than doubled the impact on households through the June 2010 emergency budget and latterly through the Spending Review.
All of the changes have been modelled by the Institute of Fiscal Studies for two periods.[36] For the years 2010-11 to 2012-13, households in N. Ireland will lose on average 2.8 per cent of disposable income. The richest quintile lose 3.4 per cent while the poorest loses 2.7 per cent. When the whole Spending Review period is considered (2010-11 to 2014-15), the picture changes. Households in the richest quintile stand to lose 3.8 per cent while those in the poorest quintile lose 5.5 per cent. If the calculation is done on a N.Ireland basis only, the average loss for households in the lowest income quintile is 5.4 per cent and 3.8 per cent for the richest. Whichever method is used for modelling the changes, the affects are worse for lower income groups.
Table 9: Proportion of households (benefit units) receiving tax credits and benefits
| State support received | England | Wales | Scotland | Northern Ireland | United Kingdom |
| Working Tax Credit | 5 | 5 | 5 | 7 | 5 |
| Child Tax Credit | 14 | 15 | 13 | 15 | 14 |
| Retirement Pension | 25 | 28 | 25 | 21 | 25 |
| Child Benefit | 22 | 24 | 21 | 26 | 22 |
| Income Support | 5 | 6 | 5 | 8 | 5 |
| Incapacity Benefit | 3 | 6 | 5 | 5 | 4 |
| Severe Disablement Allowance | 1 | 1 | 1 | 1 | 1 |
| Attendance Allowance | 3 | 3 | 3 | 3 | 3 |
| Carer's Allowance | 1 | 2 | 1 | 2 | 1 |
| Disability Living Allowance (care component) |
6 | 9 | 7 | 10 | 6 |
| Disability Living Allowance (mobility component) | 5 | 9 | 7 | 10 | 6 |
Source: Family Resources Survey 2008-09, Department of Work and Pensions. p. 30.
The second reason is that a higher proportion of total household income is sourced from welfare benefits, especially benefits subject to the planned changes: 10 per cent for Northern Ireland compared to the UK average of 6 per cent. Table 9 provides the details for benefit receipt. Overall, 3 per cent of total household income in Northern Ireland comes from disability related benefits which are a particular target for change.[37] Five per cent of children aged 15 and under have a disability or long-standing limiting illness and a fifth of households have one or more disabled adults below pension age (17% for the UK as a whole). As Table 10 shows, not only is a higher proportion of Northern Ireland's population in receipt of Disability Living Allowance, but the average amount of benefit is higher.[38] Moreover, receipt of particular levels of care and mobility components can act as a trigger for other forms of help including entitlement of the recipient's carer (if they have one) to claim Carer's Allowance. Thus, loss of DLA can have unforeseen implications for more people than the sole claimant.[39]
With the exception of London, N. Ireland households will lose the most from the changes. There are two main reasons for this. The first is demographic: N. Ireland has a relatively high proportion of households with children, a group that 'will particularly lose out from tax and benefit reforms to be introduced over this period irrespective of their position in the income distribution'.[40] As Table 9 shows, 26 per cent of households in N. Ireland receive Child Benefit and a relatively low proportion receive retirement pensions.
The second reason is that a higher proportion of total household income is sourced from welfare benefits, especially benefits subject to the planned changes: 10 per cent for Northern Ireland compared to the UK average of 6 per cent. Overall, 3 per cent of total household income in Northern Ireland comes from disability related benefits which are a particular target for change.[41] Five per cent of children aged 15 and under have a disability or long-standing limiting illness and a fifth of households have one or more disabled adults below pension age (17% for the UK as a whole). As Table 10 shows, not only is a higher proportion of Northern Ireland's population in receipt of Disability Living Allowance, but the average amount of benefit is higher.[42] Moreover, receipt of particular levels of care and mobility components can act as a trigger for other forms of help including entitlement of the recipient's carer (if they have one) to claim Carer's Allowance. Thus, loss of DLA can have unforeseen implications for more people than the sole claimant.[43]
Table 10: Disability Living Allowance by population and average award
| DLA allowances current at 2009 (% population) |
Average weekly amount of benefit |
|
| Great Britain | 5.2 | £70.54 |
| England | 4.9 | £70.02 |
| Wales | 8.5 | £71.92 |
| Scotland | 6.5 | £72.14 |
| Northern Ireland | 10.2 | £77.81 |
Source: Department of Work and Pensions.
The conclusion is clear: a proportionately larger number of households in N. Ireland will see their income diminish as the £18 billion in benefit cuts are implemented. The equality impact of the benefit changes also needs to be looked at carefully, particularly in relation to disability, gender, those with dependants and those from different community backgrounds – 13 per cent of Catholic household income is sourced from social security benefits compared to 9 per cent of Protestant household income.
Conclusion
The main point that emerges from this paper is that the living standards of the worst off will decline as a result of the Spending Review. Economic and social marginalization will continue to increase in the absence of compensatory strategies and employment growth. The real scale of the Treasury reduction in Northern Ireland's budget is such that great imagination will be required both in the development and protection of key services, and in devising new revenue streams.
Clear principles and priorities are required for this, enabling the integration of strategies across Departments and policy areas. The thinking behind Green New Deal provides a model for the type of approach required, even if implementation lags far behind the vision. This submission argues that the priority for the Budget and subsequent actions is two-fold:
a) to protect the living standards of those at the lower end of household income distribution, and especially the prospects and opportunities for the children in those households;
b) to improve the quality of life in households and communities most affected by the recession.
One way to further these aims is in the design of new revenue streams, whether these involve charges, investment funds, rates, or tax varying powers (both tax reliefs and impositions). The implication of this is that revenue raising should either be progressive (with the better-off paying more relative to income) or should have an identifiable social or environmental objective. In the case of water services, both objectives could be achieved. Raising the price of alcohol could be done in such a way as to provide a revenue stream and reduce alcohol consumption and the attendant harms in relation to health and public safety. A variation of congestion charging (eg charging for road access to retail centres and other facilities) provides a revenue stream but may also encourage people to use their cars less. Charging can be used to deter parents from taking children to school by car, encouraging the proven benefits of walking and biking to school.
Transport lends itself to progressive taxation because the proportion of household income spent on transport goes up as income rises. It is also environmentally desirable that people use smaller cars. So there is potential to address vehicle registration and road tax charges. Annual boat registration could be looked at. Air passenger charges for local flights (Ireland and Britain) for exit and entry could be introduced.
Another possible revenue stream is a land value tax. Several countries apply such a tax and the Irish Government will introduce a site value tax on non-agricultural land from 2013. In the UK context, the case for a land tax has progressed furthest in Scotland.[44]
Finally there are a number of established policies and funding arrangements that are candidates for review. Capital projects developed under the widely-discredited and costly Private Finance Initiative are one example.[45]
[1] For further details see http://www.poverty.ac.uk
[2] HM Treasury (2010) Spending Review 2010, Cm. 7942. London: Stationery Office.
[3] Northern Ireland Executive, Investment Strategy for Northern Ireland 2008-2018.
[4] Press Release, 20 October 2010.
[5] BBC News, 21 and 22 October 2010.
[6] Commons Health Committee, Second Report. Public Expenditure. 9 December 2010, para. 50.
[7] Source: HM Treasury (2010) Spending Review, Cm 7942. London: Stationery Office.
[8] Northern Ireland Executive, The Investment Strategy for Northern Ireland 2008-2018. p. 5.
[9] Agreement at St Andrews. http://www.nio.gov.uk/st_andrews_agreement-2.pdf
[10] See HM Treasury, Funding the Scottish Parliament, National Assembly for Wales and Northern Ireland Assembly: Statement of Funding Policy, 2010.
[11] The Spending Review states: 'The Government agreed that as part of the £6.2bn cuts to 2010-11 budgets the Devolved Administrations could defer their cuts to 2011-12. The settlements presented here assume the Northern Ireland Executive take their cuts in 2010-11, the Scottish Executive take their cuts in 2011-12, and the Welsh Assembly Government split their cuts equally between 2010-11 and 2011-12. These settlements are subject to change as the Devolved Administrations finalise when (sic) their spending plans.'
[12] Department of Trade and Investment, Monthly Labour Market Report. January 2011.
[13] Equality Commission for Northern Ireland (2010) A profile of the Monitored Northern Ireland Workforce, Summary of Monitoring Returns 2009. Monitoring Report No. 20.
[14] Department of Enterprise Trade and Investment NI, Northern Ireland Quarterly Employment Survey Historical Data
[15] Department of Trade and Investment, Monthly Labour Market Report. January 2011.
[16] PricewaterhouseCoopers, Northern Ireland Economic Outlook, July 2010.
[17] Work Foundation (2010) The Jobs Gap. London. p. 15.
[18] Op. Cit. p. 10.
[19] PricewaterhouseCoopers (2010) Sectoral and Regional Impact of the Squeeze.
[20] Office of Budgetary Responsibility (2010) Economic and Fiscal Outlook, November 2010. pp. 62-66.
[21] Annual Survey of Hours and Earnings, 2010.
[22] The Fawcett Society sought a judicial review of the June Emergency Budget on the grounds that "the government should have assessed whether its budget proposals would increase or reduce inequality between women and men". (www.fawcettsociety.org.uk) Mr. Justice Ouseley dismissed the case but acknowledged that the impact of the budgetary cuts deserved further scrutiny, best carried out by the Equality and Human Rights Commission.
[23] Draft Budget, para. 2.30.
[24] The Varney Report (2007) Review of Tax Policy in Northern Ireland. p. 4.
[25] Northern Ireland Economic Reform Group (2010) The case for a reduced rate of Corporation Tax in NI. See also Hewitt, V. (2007) 'Differential Corporation Tax in Northern Ireland: Analysis and Policy', Northern Ireland Economic Bulletin, pp. 36-43.
[26] Evidence to Northern Ireland Affairs Committee, 20 September 2010.
[27] Stiglitz, J., Sen, A. and Fitoussi, J-P. (2009) Report by the Commission on the Measurement of Economic Performance and Social Progress. http://www.stiglitz-sen-fitoussi.fr
[28] PricewaterhouseCoopers (2011) Corporation Tax: Game Changer or Game Over? p. 6.
[29] Murphy, R. (2010) Lowering Northern Ireland's Corporation Tax: Pot of Gold or Fool's Gold.
[30] In December 2008, Lord Oakeshott famously referred to Dublin as 'Liechtenstein on the Liffey': "Ireland is a small country with a very large financial sector. It promotes itself as a low-tax zone off north-west Europe, a kind of Cayman Islands in a cold climate, and aggressively chases footloose financiers and less scrupulous British companies to move to Dublin to dodge tax. British taxpayers suffer twice from that because it also makes it much more difficult for our Revenue and Customs to make British-based multinationals pay their fair share. Dublin does not need to be Liechtenstein on the Liffey. If you set out to attract mobile money from around the world, you run much bigger risks when things go wrong." House of Lords debates, 8th December 2008. See also Fintan O'Toole, 'Liechtenstein on the Liffey': State policy has turned Dublin into a wild frontier of cooked books and dodgy transactions. The Guardian, 27th February.
[31] Murphy (2010) p. 4.
[32] Murphy (2010) p. 20.
[33] O'Toole notes that "in return for housing these front companies and allowing their parents to avoid taxes in their home countries, Ireland got no jobs but it did get the tax revenue. Essentially the deal was that the front companies would pony up 12.5 per cent of profits in corporation tax and the state would neither look too closely at its activities nor listen to the complaints of the foreign governments whose exchequers were losing out." O'Toole, Fintan (2009) Ship of Fools. London: Faber and Faber, pp. 132-3.
[34] Northern Ireland Assembly, Meeting with Local Banks. Research and Library Service Briefing Paper no.97/10, 16 September 2010.
[35] Draft Budget, para. 3.44.
[36] Browne, J. (2010) The Impact of Tax and Benefit Reforms to be Introduced between 2010-11 and 2014-15 in Northern Ireland. London: Institute for Fiscal Studies.
[37] Family Resources Survey 2008-09, p. 21.
[38] DLA awards vary depending on whether a person is in receipt of low, middle or higher rate of the care component and/or higher or lower rate mobility component.
[39] Thomas, A. and Griffiths, R. (2010) DLA and Work: Exploratory research and evidence review, Department for Work and Pensions Research Report Number 648.
[40] Browne, J. (2010) p. 13.
[41] Family Resources Survey 2008-09, p. 21.
[42] DLA awards vary depending on whether a person is in receipt of low, middle or higher rate of the care component and/or higher or lower rate mobility component.
[43] Thomas, A. and Griffiths, R. (2010) DLA and Work: Exploratory research and evidence review, Department for Work and Pensions Research Report Number 648.
[44] Wightman, A. (2010) A Land Value Tax for Scotland. http://www.andywightman.com/docs/LVTREPORT.pdf
[45] See Daily Telegraph 24th and 29th January 2011.
Appendix 7
Research Papers

Paper 000/00 21 October 2010 NIAR 545-10
The Comprehensive Spending Review 2010: estimated impacts on Northern Ireland
1. We are grateful for the assistance of Victor Hewitt in compiling this paper
Executive Summary
This paper summarises the outcome of the Comprehensive Spending Review (CSR), focusing on the potential economic implications for Northern Ireland.
The Extent of the Cuts
- According to HM Treasury figures[1], total Departmental Expenditure Limit (DEL) in 2014/15 will be £1.05bn (10.3%) less, in real terms, than in 2010/11.
- However, this figure may understate the true impact of the cuts since changes in accounting mean that it is exclusive of depreciation and other non-cash items. Once these have been accounted for, (which is the approach that has been adopted by PricewaterhouseCoopers (PwC)), the difference is larger. PwC indicate that, on this basis, there has in fact been a £1.4bn reduction in total DEL (2014/15 compared to 2010/11) in real terms (12.6%)
- DFP is viewing the cuts on a cumulative basis, i.e. total cuts over the entire spending period, as opposed to comparing allocations in 2014/15 with those in 2010/11. On this basis, they are estimating that the cuts will amount to £4 billion in real terms between 2010/11-2014/15. We are still awaiting more detailed figures from the Department of Finance Personnel (DFP) to enable us to derive a comparative figure as to their estimation of the reduction in real-terms total DEL between 2010/11 and 2014/15.
- End-Year Flexibility (EYF) is to be abolished from the end of the 2010/11 financial year along with all accumulated stocks.
- There is a lack of clarity surrounding the Northern Ireland baseline for 2010/11. It appears that the Executive decision to incur current year savings in the region of £100m in the baseline year (2010/11) has had a negative impact upon subsequent allocations.
The Impact of the Cuts
- Ultimately, the economic impact of the cuts outlined in the CSR will depend upon how they are allocated across departments by the Northern Ireland Executive.
- However, in the absence of this detail, this paper draws upon an analysis, produced by PricewaterhouseCoopers (based on established financial models), which estimates the overall impact of £1.4bn in cuts on the Northern Ireland economy over the four-year period.
- The key findings of this are as follows:
- According to the CSR total, Departmental Expenditure Limit (DEL) funding for all Northern Ireland departments (including the Department of Justice) will be £0.3bn less in 2014/15 than in 2010/11. In real terms, this is equivalent to a reduction of £1.4bn.[2]
- This is equivalent to an average annual percentage decline, in real terms, of 2.0 %.
- With regards to the estimated impact on Gross Value Added (GVA), PwC estimates that a reduction in DEL of £1.4bn would be equivalent to -4.8% of Northern Ireland's GVA in 2014. However, a caveat on this estimate is that it does not account for cuts in welfare components of Annually Managed Expenditure (which are likely to be significant). Thus this is likely to understate the true scale of the effect.
- With regards to public sector jobs, PwC estimates that if the entire cut was offset against public sector employment (an unlikely situation, but usual in reflecting, in terms of jobs, the scale of the total cuts), this would result in a reduction in public sector employment of 41,200. This figure is intended to reflect the 'job equivalent' of the cuts, and is not a projection for job-losses.
- In respect of private sector jobs, PwC estimates that, when multiplier[3] effects are accounted for, Northern Ireland could be facing the largest potential reduction in private sector jobs in the UK; with a potential 5% loss over the five year period.
- Welfare reform is likely to have particular significance for Northern Ireland. There is a greater relative reliance upon the welfare system in Northern Ireland; benefits represent 10% of household income here, compared to a UK average of 7%. Welfare recipients represent a 50% greater proportion of the population in Northern Ireland, compared with the UK average. Furthermore, Northern Ireland's 60+ share of the population is projected to grow more rapidly than in GB over the next fifty years.
- Finally, with regards to the Investment Strategy for Northern Ireland (ISNI), the planned reduction of £500m in capital DEL (40% in real terms) over the next four years will have significant implications for the economy and upon the local construction sector.
1. Overview
The purpose of this briefing paper is to provide Members of the Northern Ireland Assembly with background to, and an initial assessment of, the UK Government's Comprehensive Spending Review (CSR). The paper presents consideration of the impact of the spending limits allocated to the Executive.
1.1 What is the Comprehensive Spending Review?
The CSR is the mechanism through which the UK Government allocates Departmental Expenditure Limits (DEL) to each of the departments across Whitehall and to the devolved administrations. For the purposes of public expenditure control, the devolved administrations' allocations are set out in exactly the same way as, for example, the Department for Work and Pensions.
CSR 2010 sets expenditure limits for current and capital spending for each year from 2011/12 to 2014/15. These are firm and fixed overall limits, but it remains at the discretion of the devolved administration or department how to distribute this spending within their areas of responsibility.
1.2 Background to the CSR
There has been widespread public debate in recent months about the necessity for, and timing and level of, fiscal consolidation in the UK. This paper does not seek to contribute to that debate; it is concerned with what the potential impacts of the UK Chancellor's announcement might be for Northern Ireland. It is however useful to highlight in broad terms what the UK Government is planning.
The UK Government's deficit-reduction strategy
The Government's top priority is reducing the budget deficit which was £156 billion in 2009/10. The Budget set out plans to cut the deficit, announcing £32 billion of spending cuts by 2014/15. These are in addition to the reductions in spending which had been planned by the previous Labour Government. Public spending is forecast to fall in real terms for each of the next four years. This is a very sharp reduction: since 1970, spending has fallen in real terms in only five years and only once for two consecutive years (1996/97-1997/98). Despite these cuts, public spending as a share of the economy in 2015/16 will still be higher than it was in 2003/04.[4]
What is fiscal consolidation?
Fiscal consolidation is the rebalancing of revenues and expenditures. It may be required to redress the exceptionally high UK public debt levels to avoid the possibility of the UK's credit rating being downgraded. This would result in a reluctance to lend to the UK on international money markets, making credit less accessible, more expensive and thereby adding to current costs of servicing the public debt.
More detail on fiscal consolidation, lessons from other Governments' attempts at re-balancing and a summary of some characteristics of those approaches that were deemed to have been successful are available in Assembly Research Paper NIAR 367-10 Re-balancing Public Finances: Lessons from Past Experiences.[5]
The UK Government's approach has been to focus the effort of consolidation mostly on the implementation of expenditure reductions rather than on tax rises.
The May 2010 spending reductions
The incoming Coalition Government announced in May 2010 total UK public spending reductions of £6.2 billion for 2010/11.[6] The Northern Ireland Executive's share of these reductions was £127.9 million.[7] This has been mostly managed through the in-year monitoring process, although there is an option for the Executive to carry forward the reductions into 2011/12.
Giving evidence at the Finance and Personnel Committee on 29 September 2010, an official stated:
As we leave September monitoring, the position is that the overcommitment is cleared on the capital side, and we still have a balance of just under £17 million of an overcommitment on the current side.[8]
This means that if there is to be no carrying over of overcommitment into 2011/12, the Executive has to find a further £17 million in the remaining monitoring rounds this year (December and February); as usual it will also have to manage any further in-year expenditure pressures that emerge. Assuming it can do so, it will start the next fiscal year with a clean slate. If it cannot, any overcommitment will have to be met from the Executive's allocation set out below in section 3.
1.3 How is the Northern Ireland Executive's share determined?
For the most part, the Executive's DEL allocation is calculated formulaically according to changes to comparable spending programmes in Whitehall departments' allocations; there is also the application of a population-based element. For more detail on the workings of devolved funding see Assembly Research Paper NIAR 49/09 The Barnett Formula.[9]
Other elements of public expenditure are not set through the Barnett Formula. As well as getting an equivalent share of spending on programmes, Northern Ireland has also attracted some additional funding through what could be called 'extra-Barnett' allocations – such as for match funding under European Peace programmes, for example. The Executive was also granted limited borrowing powers under the Reinvestment and Reform Initiative (RRI) for funding infrastructural development.[10]
The major components of the assigned budget outside DEL are known as Annually Managed Expenditure (AME):
- Social security benefits;
- NHS and teachers' pensions;
- Certain accrual items such as capital charges for roads and the water service;
- RRI self-financed borrowing and district councils self-financed expenditure; and,
- Regional rates.
The former two elements are determined and forecast annually. It should be noted that AME funding is on a 'sale or return' basis; if the level of expenditure on these items is lower than the forecast, there is no mechanism for the Executive to transfer the surplus into DEL.
The latter three are determined locally by the Executive and Northern Ireland's district councils.
The treatment of the Department of Justice in Northern Ireland is also handled differently. In evidence to the Committee for Justice in September, an official stated:
If our budget is ring-fenced — which I believe it probably will be, although that will be an Executive decision, not one that we can make — we will take the direct Barnett consequentials of the Home Office and the Ministry of Justice. If those Departments receive a 25% cut, it will probably mean around a 12% to 15% cut for us.[11]
Later on, the consideration of ring-fencing was touched on again:
Overall, the view is that there is still a willingness to ring-fence our budget for the next four years.[12]
It should be noted that this concept of 'ring-fencing' is rather different from the Executive choosing to protect a certain area of its budget from cuts. In the context of the Department of Justice it means that any changes to the Home Office and Ministry of Justice's allocations would be directly hypothecated via the Barnett Formula to the Northern Ireland Department of Justice – this marks a departure from the established approach whereby all of the Executive's DEL is unhypothecated.[13]
For clarity, it should be noted that funding for the Department of Justice has been included in the Northern Ireland Executive's DEL in the CSR.
Statement of Funding Policy
The UK Treasury's Statement of Funding Policy[14] was published in October 2007 (the same time as the last CSR), and a new version has been published alongside CSR 2010.[15] Among other things, it explains the rules for carry-forward of unused resources from one year to the next – known as 'End-Year Flexibility.' (EYF) It is important to note in the current context that access to stocks of EYF is not automatic and requires the approval of the Treasury.[16]
End-Year Flexibility
The EYF scheme allows departments and devolved administrations to carry forward underspend resources from one year to the next and accumulate these as stocks. According to the UK Treasury's provisional outturn for 2009-10 the Northern Ireland Executive's total EYF stock was £624,478,000.[17] As stated above, drawdown of these stocks requires approval from the Treasury. However, the CSR announces that the UK Government is:
abolishing the EYF scheme at the end of 2010-11, including all accumulated stocks, and replacing it with a new system from 2011-12 which will retain an incentive for departments to avoid wasteful end-year spending and strengthen spending control. Further detail will be set out later this financial year.
Whilst the policy for the new system is yet to be announced, it is clear that the existing stock will no longer be available to the Executive from the next financial year.
2. CSR 2010: Summary of key messages – UK level
- The CSR sets out departmental spending limits for the four years until 2014-15 (refer Table 1 below) and further savings and reforms to welfare, environmental levies and public service pensions.
- Public spending as a percentage of GDP will return to the level seen in 2006-07, and in real terms it will return to around the level seen in 2008-09.
- The CSR has increased the capital envelope by £2.3 billion a year by 2014-15 relative to the Budget plan.
- The CSR has, for the first time, covered key areas of Annually Managed Expenditure (AME) in addition to Departmental Expenditure Limits (DELs) for each government department and for the devolved administrations.
- The Spending Review commits to:
- Providing an NHS in England that is free at the point of use and available to everyone based on need, not the ability to pay. Total NHS spending will increase in real terms in each year of the Parliament; and,
- Uprating the basic State Pension by a triple guarantee of earnings, prices or 2.5 per cent, whichever is highest from 2011, while bringing forward the date at which the State Pension Age will start to rise to 66 to 2020.
Spending Review Measures in Support of the Government's Priority of 'Growth'
- More than £10bn over the Spending Review to provide new road schemes / maintain existing roads; funding Crossrail and improvements to the London Underground network. £14bn for rail improvements including station upgrades in Birmingham, towns around Manchester, Yorkshire, etc;
- Rolling out superfast broadband access across the country; a Regional Growth Fund of £1.4 bn; investing £1bn with proceeds from sale of government-owned assets to provide incentives for investment in low-carbon economy through Green Investment Bank; and,
- £250m extra funding compared to previous Government for new adult apprenticeships; maintaining science budget in cash terms.
Spending Review Measures in Support of the Government's Priority of 'Fairness'
- Protecting schools spending, and introducing a new fairness premium worth £7.2bn in total, to support poorest in early years and at every stage of education;
- Improving sustainability of welfare state by ensuring the amount a household can receive from welfare does not exceed that earned by an average family that works; withdrawing Child Benefit from higher-rate tax payers;
- Making social housing more 'responsible, flexible and fair'; meeting Coalition Agreement's pledge to make in the region of £1.5bn available for the Equitable Life Payments Scheme; and,
- Maintaining commitment to spend 0.7 per cent of Gross National Income (GNI) on international development aid by 2013.
Spending Review Measures in Support of the Government's Priority of 'Reform'
- Localising power/funding, including removing ring-fencing resources to local authorities/extending the use of personal budgets for service users;
- Cutting burdens/regulations on frontline staff, including policing, education and procurement;
- Increasing diversity of provision in public services; and,
- Improving transparency, efficiency and accountability of services.
Major reforms announced in the Review include:
- A settlement for local government that increases local authorities' freedom to manage their budgets, but will require choices on how services are delivered within reduced allocations;
- Reforms to the sentencing framework so that it punishes/rehabilitates more effectively;
- Ensuring the effectiveness of frontline policing by reviewing terms/conditions of service and generating efficiencies in IT, procurement and back office;
- Accepting findings of interim Hutton Report on public service pensions, the UK Government will continue with a form of defined benefit pension and seek changes to employee contributions that will enable £1.8bn of savings a year by 2014-15 (the exact nature of benefits/level of contributions will be made upon receipt of Lord Hutton's final recommendations); and,
- Action to cut the cost of central government, with a 34 per cent cut in administration budgets across Whitehall and arms-length bodies, saving £5.9bn a year by 2014-15.
Table 1 HM Treasury Spending Review – Resource and Capital DEL
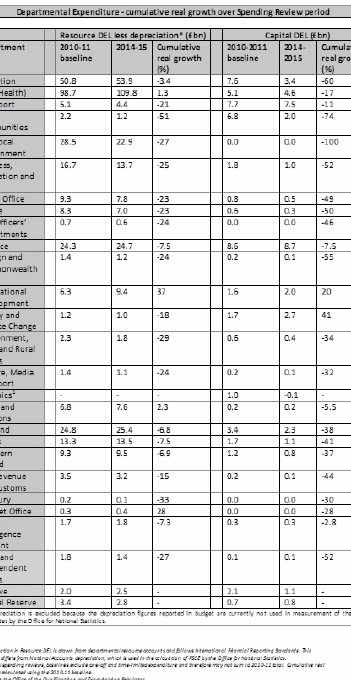
3. CSR 2010: Northern Ireland's allocation.
Comparisons between the CSR allocations for 2010/11-2014/15 with previous allocations are complicated by a number of factors, including:
- The inclusion of Department of Justice funding in the 2010/11 baseline position reported in the Review document;
- The exclusion of depreciation and other non-cash items from the baseline figure outlined in the Review document.
However, the Figures presented by HMT in the CSR report for resource and capital expenditure over the next four years are depicted in Figure 1 (nominal terms) and Figure 2 (real terms). (source HM Treasury)
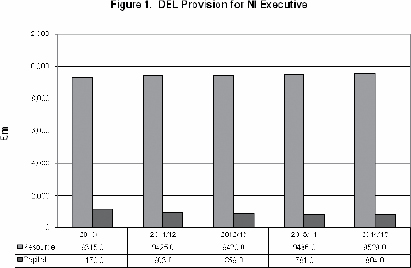
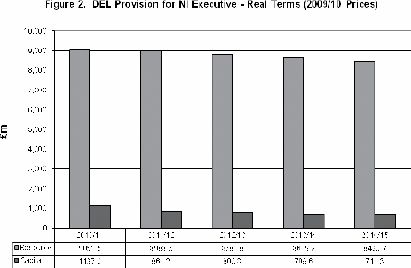
Note: above figures derived using HM Treasury latest available GDP deflators.
Provision for Presbyterian Mutual Society
The CSR announcement included scope for the Executive to borrow £175m "to ensure a fair and just resolution of issues arising from the collapse of the Presbyterian Mutual Society."[18] Provision for this borrowing appears to have been applied to Northern Ireland's AME through the Reinvestment and Reform Initiative (RRI) line.[19]
The RRI is the mechanism through which the Executive can borrow from the National Loans Fund (which is the UK Government's main borrowing and lending account) for the purposes of capital investment. Effectively then, the CSR allows the Executive to treat the resolution of the Presbyterian Mutual Society as capital expenditure in order to allow for savers to have their savings returned to them.
It is not clear from the information currently available whether this £175m is taken from the Executive's annual £200m borrowing limit under RRI for 2011/12; an Executive press release from 16 April 2010 seems to imply that Treasury approval was needed to "extend the RRI borrowing facility."[20][emphasis added] This seems to suggest that the £175m loan is in addition to the current limit of £200m per annum.
The effect of this therefore would not be to reduce the Executive's ability to borrow to fund capital investment which would constrain further spending plans beyond the reductions in capital DEL.
What can be said with certainty is that if the £175m is additional to the £200m RRI ceiling then the Executive could potentially incur a much greater level of debt. Debt has to be serviced which will create pressure on the budget. Secondly, the CSR has provided £25m towards the hardship fund. If the Executive is to make this up to the £50m figure announced in April, there is an additional funding pressure for 2011/12.
4. Impact of the CSR on Northern Ireland.
This section briefly highlights some of the issues that face the Northern Ireland economy, focusing on those that make it particularly vulnerable to cuts in public spending. Some results of modelling of the potential economic impact of the CSR announcement by PwC are then presented.
4.1 The Northern Ireland Economy
A Relative Vulnerability to Public Sector Cuts
There are a number of factors, specific to the NI economy, which could be argued to make us particularly vulnerable to the impending cuts in public expenditure.
- The Size of the Public Sector: The public sector in NI (including Reserved functions[21]) employs approximately 226,000 people; equating to 32.3% of all employee jobs. This is significantly higher than the equivalent figure in the rest of the UK (21.1%)[22]. The cuts to public expenditure and/or employment levels, implied by the CSR 2010, will thus have a disproportionate impact on the NI economy.
- Characteristics of the Private Sector: An additional difficulty that NI faces is that the ability of the local private sector to adequately 'pick up the slack' is questionable; productivity levels in NI remain below UK average levels (in fact the gap has widened over recent years). Whilst job creation took place during 1998-2008, boosting employment figures, this has tended to have been associated with low value-added jobs (for example in call centres).
Companies in NI also have a limited export base; unless they become more 'outward looking'[23], declining levels of expenditure amongst consumers and by Government imply limited scope for growth.
- Local Banking Issues: Another impediment to economic recovery, which is relatively specific to Northern Ireland, is the remaining constraints on bank lending levels. NI has a relatively concentrated banking sector, with four leading local banks, two of which are Irish-owned (First Trust and Bank of Ireland). Thus in obtaining credit facilities, NI businesses are exposed to the issues associated with the Irish banking sector, including the outworking of the National Asset Management Agency (NAMA). For example, First Trust Bank is currently not actively seeking new customers, having recently been instructed by the Financial Services Authority (FSA) to reduce its loan to deposit ratio. NI has also had the lowest uptake rates of Government bank lending schemes (intended to enhance the accessibility of credit for businesses) in the UK[24]. These are significant issues, since restoring bank lending levels[25] is a necessary precondition for economic recovery.
- Relative Reliance on the Welfare System: The proposed scale of welfare reform in the UK may be particularly problematic for NI. Northern Ireland has comparatively high levels of deprivation, disadvantage and poverty; some of which is a legacy of years of conflict[26]. We also have a relatively high rate of economic inactivity in NI relative to other UK regions (28.5% as opposed to a UK average rate of 23.2%), and this is reflective, at least in part, of the proportion of individuals who currently claim Disability Living Allowance (28% of the economically inactive are sick/disabled)[27].
- Property Market/Construction Industry: Northern Ireland experienced an extreme spike in property prices in 2006-07, and the 'bursting of the bubble' has been accordingly painful. House prices have fallen by more in Northern Ireland than in any other UK region. This has clear implications for confidence levels and transaction levels are correspondingly low[28]. According to Ulster Bank, the re-adjustment in average house prices, since the peak in August 2007, has now reached 42% - this is illustrated, relative to other UK regions, in Figure 3 below[29]. Furthermore, leading forecasts indicate that this trend is set to continue for some time, (albeit at a slower rate), with a return to growth in average prices anticipated around 2013[30].
The local construction industry has suffered accordingly; it is thus extremely vulnerable in the face of the planned cuts to capital expenditure.
Figure 3 – Fall in Northern Ireland House Prices
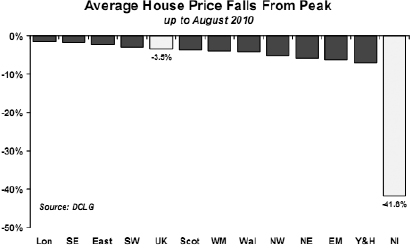
Source: Northern Ireland's Housing Market Update, Ulster Bank, October 2010
Many of the factors outlined above are issues that other regions have also faced/continue to face; however, the point is one of proportionality. Northern Ireland is disproportionately exposed to a number of risks, which render it particularly vulnerable to the public sector cuts outlined in the CSR. In the same way that growth in public expenditure has contributed significantly to economic growth in NI over recent years, the scale of the spending reductions present a considerable risk of a prolonged economic contraction.
Other General Features of the NI Economy
Other features of the Northern Ireland economy were highlighted by the Independent Review of Economic Policy in September 2009 (IREP - also known, somewhat confusingly in the context of this paper, as 'the Barnett Review'. For the avoidance of doubt, this review was not a review of the Barnett Formula).[31] Some of the headline findings of that Review were:
- Living standards in Northern Ireland are around 80% of the UK average;
- Labour productivity has weakened since 1997 and the gap with the UK average has widened;
- The sectoral mix of the Northern Ireland economy (measured by employment) shows higher than UK average reliance on sectors with typically lower productivity such as health, agriculture, construction, retail, manufacturing and education;
- The sectoral mix of the Northern Ireland economy (measured by employment) shows lower than UK average reliance on higher-end sectors such as business services, personal and financial services;
- Northern Ireland's employment rate is consistently below the UK average and correspondingly the level of economic inactivity is higher than in any other UK region;
- Business expenditure on research and development is lower than the UK average; and,
- A much higher proportion of those of working age has no academic qualification compared to the UK average (in 2008, 22% in Northern Ireland compared to UK average of 12%).
In addition to these structural weaknesses, the progress of economic recovery in Northern Ireland has been weaker than in the rest of the UK. In particular:
While private-sector activity has picked up a little in recent months, it remains fragile and does not look capable of replacing any significant contraction [in] public-sector activity. [32]
Indeed, a recent report by Ulster Bank revealed that:
… the downturn in the Northern Ireland private sector economy continued in September. Business activity fell for the tenth month in a row, as the level of new work received posted a further marked decline.[33]
In part, this is a reflection of low consumer confidence. A recent survey of confidence by the Northern Bank found that:
Of the 1,000 people surveyed, only 15 per cent believed that their household finances would improve over the next 12 months, while 28 per cent felt that their financial position would worsen. In addition, 35 per cent of households felt that their finances had already deteriorated relative to one year ago.[34]
4.2 What does the outcome of the CSR imply for Northern Ireland?
The ultimate economic impact of the CSR will depend upon how the Northern Ireland Executive decides to allocate the cuts across the various departments, and whether, for example, health or education expenditure is ring-fenced. It will also depend on whether the Executive re-allocates any current expenditure in respect of capital spends. These decisions will be consulted upon, and ultimately presented in the Executive's Budget 2011-15.
In the absence of this detail, and to enable a broad quantification of the implications of the CSR announcement on the local economy in the meantime, the Assembly Research Service has commissioned a piece of research by PwC to attempt to broadly quantify the economic impact of the cuts for Northern Ireland (for example, with respect to employment levels).
The key findings of their analysis are as follows:
- According to the CSR total, Departmental Expenditure Limit (DEL) funding for all Northern Ireland departments (including the Department of Justice) will be £0.3bn less in 2014/15 than in 2010/11. In real terms, this is equivalent to a reduction of £1.4bn[35].
- This is equivalent to an average annual percentage decline, in real terms, of 2.0 per cent.
- With regards to the estimated impact on GVA, PwC estimates that a reduction in DEL of £1.4bn would be equivalent to -4.8% of Northern Ireland's GVA in 2014. However, a caveat on this estimate is that it does not account for cuts in welfare components of Annually Managed Expenditure (which are likely to be significant). Thus this is likely to understate the true scale of the effect.
- With regards to public sector jobs, PwC estimates that if the entire cut was offset against public sector employment (an unlikely situation, but usual in reflecting, in terms of jobs, the scale of the total cuts), this would result in a reduction in public sector employment of 41,200. Once again, this figure is intended to reflect the 'job equivalent' of the cuts, and is not a projection for job-losses.
- In respect of private sector jobs, PwC estimates that, when multiplier effects are accounted for, Northern Ireland could be facing the largest potential reduction in private sector jobs in the UK; with a potential 5% loss over the five year period.
- In terms of the potential welfare reform, this is likely to have particular significance for Northern Ireland. There is a relative reliance upon the welfare system in NI, with benefits representing 10% of household income here, compared to a UK average of 7%. Welfare recipients represent a 50% greater proportion of the population in NI, compared with the UK average. Furthermore, Northern Ireland's 60+ share of the population is projected to grow more rapidly than in GB over the next fifty years.
- Finally, with regards to the Investment Strategy for Northern Ireland (ISNI), the planned reduction of £500m in capital DEL (40% in real terms) over the next four years , will have significant implications for the economy and upon the local construction sector.
5. Revenue Raising Options for the Executive
The scale of budgetary cuts might be mitigated should the Executive decide to implement increases in local taxation or revenue raising. There are a number of potential options in this regard; however, when considered within the context of the Executive's legislative competence, some may be more feasible than others.
The principle revenue raising mechanism available to the Executive is the regional rate.
Domestic regional rate
Domestic rates have been frozen in money terms for the last 3 years. The Department of Finance and Personnel's Land and Property Services has estimated the additional revenue that would have been raised by increasing the domestic rate by 3%, rather than freezing it as presented below in Table 2,
Table 2 - Estimated Revenue forgone by freezing the domestic regional rate rather than increasing by 3% per annum[36]
| Financial year | Revenue forgone |
| 2008/2009 | £8.02 million |
| 2009/2010 | £19.8 million |
| 2010/2011 | £26.2 million |
| 2011/2012 | £35.9 million |
This is a cumulative impact of over £90 million over the four-year period presented.
Note: the figures are based on projections of revenue rather than actual revenues. They also take account of increases in the tax base and changes in domestic rates reliefs over the period. The increasing revenue loss over time can be explained by the fact that the underlying tax base tends to increase in value over time, as well as a result of changes to the cost of reliefs.
Non-domestic regional rate.
For the year ending 31 March 2009, the non-domestic regional rate increased 2.7% on the preceding year. At the time this rate was announced by then Finance Minister Peter Robinson inflation was at 2.7% so this was - in effect - a real-terms freeze.[37]
For the year ending 31 March 2010, the non-domestic regional rate did not increase. This was – in effect – a real-terms cut.
For the year ending 31 March 2011, the non-domestic regional rate again increased 2.7% on the preceding year. At the time this rate was announced by Finance Minister Sammy Wilson inflation was again at 2.7% so this was again - in effect - a real-terms freeze.[38]
Both the domestic and the non-domestic regional rates could be increased to raise additional revenue, although the wider impact on economic recovery would have to be carefully considered.[39]
Other revenue-raising options
Other potential sources of additional revenue include:
- The introduction of water charges – it has been estimated that this would generate up to £200m per year[40].
- Abolishing free prescriptions – it is anticipated that this could generate up to £13m per year.
- Ending free travel for 60-64
- Following the Lord Browne report[41] recommendations on removing cap on university tuition fees
Other, less conventional, possibilities (for which legislative/authoritative feasibility would have to be more clearly established) include:
- A tax on mobile phone text messages;
- A car parking levy across the public sector;
- Northern Ireland Executive Bonds; or,
- An increased charge on MOT tests
6. Conclusions
- There is a lack of consensus as to the exact scale of the cuts to total DEL in NI; this appears to be associated with issues around the exclusion of depreciation/other non-cash items, the savings which are to be incurred in the current year, and the inclusion of DoJ funding in the CSR baseline.
- However, there is a consensus view that the real challenge for NI will be in respect of the significant cuts to capital expenditure over the Spending Review period.
- The Executive will need to consider alternative options, to ensure that these cuts do not leave a legacy impact in economic terms. These might include assessing alternative means of raising revenue (as outlined in section 5) or transferring resource allocations to capital spend. Given the existing constraints on current expenditure allocations, this would be a very difficult decision; however, it is important that the Budget is approached from a strategic, longer-term point of view to ensure economic sustainability in Northern Ireland.
- Finally, it is worth highlighting that the real-terms cuts in total DEL could be significantly larger should the rate of inflation exceed current forecasts (upon which 'real' cuts have been derived). This is a possibility, especially should the Bank of England vote on another round of Quantitative Easing in the UK (as is the current thinking in the US). However, this risk may be offset to some degree by public sector pay freezes.
7. Points for Further Clarification
The following issues may be worthy of further clarification with DFP, to assess their potential impact on Northern Ireland funding levels:
- Presbyterian Mutual Society: further details might be sought to establish whether the £175m borrowing allowance, granted to the Executive in respect of a resolution of the PMS situation, will be taken from the Executive's annual £200m borrowing limit under RRI for 2011/12. Furthermore, the CSR provided £25m towards the hardship fund. If the Executive is to make this up to the £50m figure announced in April, there is an additional funding pressure for 2011/12.
- End-Year Flexibility: According to the UK Treasury's provisional outturn for 2009-10 the Northern Ireland Executive's total EYF stock was £624,478,000.[42] However, the CSR indicated that the Government is abolishing the scheme at the end of 2010-11. It would be useful to clarify whether this implies that the existing stock will no longer be available to the Executive from the next financial year.
- Current Year Savings: Another point which might be worthy of clarification is whether the fact that the NI Executive has opted to incur current year savings in the region of £100m in the baseline year (2010/11) has had a negative impact upon subsequent spending allocations.
Appendix: Press Coverage
BBC Northern Ireland website
(accessed on 21st October 2010)
Gerry Adams says NI Spending Review cuts 'unacceptable'
http://www.bbc.co.uk/news/uk-northern-ireland-11595597
Cuts worse than feared - Peter Robinson
http://www.bbc.co.uk/news/uk-northern-ireland-11582887
Capital projects in NI 'will suffer' because of cuts
http://www.bbc.co.uk/news/uk-northern-ireland-11590423
Attwood urges Stormont maturity over Spending Review
http://www.bbc.co.uk/news/uk-northern-ireland-11594563
NI leaders accuse government of breaking promises
http://www.bbc.co.uk/news/uk-northern-ireland-11585961
NI's £4bn cutbacks 'a real test' warns Finance Minister
http://www.bbc.co.uk/news/uk-northern-ireland-11587394
How did Northern Ireland fare in the spending cuts?
http://www.bbc.co.uk/news/uk-northern-ireland-11590417
UTV website
(accessed on 21st October 2010)
Adams hits out at 'unacceptable' cuts
http://www.u.tv/News/Adams-hits-out-at-unacceptable-cuts/3abbee4c-b3c2-48be-9c31-0fbba113350f
NI leaders 'angry' at £4bn cuts
http://www.u.tv/News/NI-leaders-angry-at-£4bn-cuts/af35737d-1f61-4307-ba87-fe51d4e6543c
£200m for PMS rescue package
http://www.u.tv/News/%c2%a3200m-for-PMS-rescue-package/73d53993-c1c8-4328-83ac-e5ac53e83753
Belfast Telegraph
Website (accessed on 21st October 2010)
Osborne's spending review axe falls on Northern Ireland 21st October 2010
http://www.belfasttelegraph.co.uk/news/politics/osbornes-spending-review-axe-falls-on-northern-ireland-14982926.html
Osborne's £200m package for Presbyterian Mutual Society 20th October 2010
http://www.belfasttelegraph.co.uk/news/local-national/uk/osbornes-200m-package-for-presbyterian-mutual-society-14982484.html
Print Edition
Thousands of redundancies on the horizon by David Gordon Pg. 2
Now we know where we stand, it's up to Stormont to do more with less by David Gordon, Pg. 2
It's a hell of a deal for Ulster: Paterson by Noel McAdam, Pg. 3
Hospitals, schools and new roads in doubt after savage cuts by David Gordon, Pg. 4
Attwood 'shocked' as the axe is wielded in benefits shake-up by Noel McAdam, Pgs 4 & 5
Presbyterian Mutual savers breathe a sigh of relief with £200m lifeline by Lesley-Anne Henry, Pg. 5
Where the axe will fall: our experts give their opinions Pgs 6 & 7
News Letter
Website (accessed on 21st October 2010)
War of words over Ulster cuts 21st October 2010
http://www.newsletter.co.uk/news/War-of-words-over-Ulster.6592400.jp
Ministers left reeling by capital cutbacks 21st October 2010
http://www.newsletter.co.uk/news/Ministers-left-reeling-by-capital.6592459.jp
How cuts will impact Ulster 21st October 2010
http://www.newsletter.co.uk/news/How-cuts-will-impact-Ulster.6592497.jp
Jobs and pensions top the list of public fears 21st October 2010
http://www.newsletter.co.uk/news/Jobs-and-pensions-top-the.6592483.jp
PMS to benefit from £200 rescue plan 20th October 2010
http://www.newsletter.co.uk/news/PMS-to-benefit-from-200.6591321.jp
'Fairly good outcome' for PMS shareholders 20th October 2010
http://www.newsletter.co.uk/news/39Fairly-good-outcome39-for-PMS.6590389.jp
Print Edition 21st October 2010
The £4 billion war of words – angry clashes as cuts revealed by Gemma Murray, Pgs. 1 & 3
Businesses react to cuts Pg. 4
Pensioners 'winners' Pg. 4
Irish News
Print Edition 21st October 2010
Cuts leave air of uncertainty Editorial, Pg. 10
30,000 public sector jobs face the chop in 'Axe Wednesday' by Gary McDonald, Pg. 12
No-one really any wiser over how much will actually be cut by Gary McDonald, Pg. 14
Alliance explanation of discrepancy between figures by Stephen Farry MLA, Pg. 14
Rescue package announced for PMS savers by John Manley, Pg. 15
North gets its lower bill with a sting in the tail by Richard Ramsey, Pg. 15
Lots of work to do when ministers meet a day late by Diana Rusk, Pg 16
Tinkering about will not cut it in education by Simon Doyle, Pg 16
Hospitals to stay on waiting list by Seanin Graham, Pg 17
Leaders' mixed responses to budget 'massacre' by Claire Simpson, Pg. 18
Paterson insists first minister was 'relieved' by Diana Rusk, Pg 18
Note: print versions are available in the Assembly Library.
[1] Adjusted for inflation using HMT deflators
[2] As calculated by PwC on the basis of Treasury and DFP assumptions regarding inflation rate expectations
[3] The multiplier effects are the indirect or 'knock-on' effects of reduced public sector spending: as fewer people are employed in both the public and private sector, the total spending in the economy is reduced.
[4] See House of Commons Briefing SN/EP/5674 available online at: http://www.parliament.uk/briefingpapers/commons/lib/research/briefings/snep-05674.pdf
[5] Available online at: http://archive.niassembly.gov.uk/researchandlibrary/2010/14710.pdf
[6]The Chancellor's speech is available online at: http://www.hm-treasury.gov.uk/press_05_10.htm
[7]DFP Press release 25 May 2010, available online at: http://www.northernireland.gov.uk/news/news-dfp/news-dfp-25052010-wilson-cut-in-public-spending.htm
[8]http://archive.niassembly.gov.uk/record/committees2010/FinancePersonnel/100929_OutcomeofSpendingRound.htm
[9]Available online at: http://archive.niassembly.gov.uk/io/research/2009/4909.pdf
[10] See http://www.ofmdfmni.gov.uk/index/economic-policy/reinvestment-and-reform-initiative.htm
[11] http://archive.niassembly.gov.uk/record/committees2010/Justice/100902Budget2010.pdf (see page 9)
[12] http://archive.niassembly.gov.uk/record/committees2010/Justice/100902Budget2010.pdf (see page 10)
[13] If an allocation is hypothecated it is must be spent for a particular purpose. If it is unhypothecated it is at the Executive's discretion.
[14] HM Treasury (2007) 'Funding the Scottish Parliament, National Assembly for Wales and Northern Ireland Assembly: Statement of Funding Policy' available online at: http://webarchive.nationalarchives.gov.uk/+/http:/www.hm-treasury.gov.uk/d/pbr_csr07_funding591.pdf (see chapter 15)
[15] HM Treasury (2010)
[16] HM Treasury (2007) 'Consolidated Budgeting Guidance from 2007-08' available online at: http://webarchive.nationalarchives.gov.uk/+/http://www.hm-treasury.gov.uk/media/0C7/B0/consolidatedbudgetingguidance_2007-08.pdf (see Chapter 15 for more detail on EYF)
[17] http://www.hm-treasury.gov.uk/d/peowp200910.pdf (see Table 6, page 17)
[18] http://cdn.hm-treasury.gov.uk/sr2010_completereport.pdf (page 70)
[19] http://cdn.hm-treasury.gov.uk/sr2010_completereport.pdf (Table 3, page 12)
[20] http://www.northernireland.gov.uk/executive-statements-index/content-newpage-150410-executive-agrees-_50.htm (final paragraph)
[21] Reserved functions include the NI Office, PSNI, NI Prison Service, UK Central Government and UK Public Corporations
[22]This is, in part, due to the lower employment rate in NI and a higher requirement for public services due to demographic structure and socio-economic status. http://www.dfpni.gov.uk/2010-11-pay-and-workforce-technical-annex.pdf
[23] However, there is the issue of where to export to: opportunities are constrained given the global economic climate.
[24] On a per head basis, the uptake of the Enterprise Finance Guarantee Scheme is lower in NI than in any other UK region
[25] This is not to say that credit should be as cheap and as accessible as it was prior to the credit crunch; this was reflective of a mispricing of risk.
[26] http://www.theyworkforyou.com/ni/?id=2010-09-13.8.1
[27] http://www.detini.gov.uk/lmr_october_2010.pdf
[28] Refer to Northern Ireland's Housing Market Update, Ulster Bank, October 2010 available online at: http://www.ulsterbankcapitalmarkets.com/home/Economist/NI_Economics_2/Housing.aspx
[29] According to the University of Ulster, the figure is slightly lower – 36%; relative regional trends are unchanged
[30] Refer to http://www.northernbank.co.uk/SiteCollectionDocuments/economic/QEO/quarterly-economic-overview-07-10.pdf
[31] Independent Review of Economic Policy (2009) available online at: http://www.irep.org.uk/Docs/report.pdf (see Chapter 2)
[32] First Trust Bank Northern Ireland Economic Outlook (2010) available online at: http://www.firsttrustbank.co.uk/servlet/BlobServer?blobkey=id&blobwhere=1044897680707&blobcol=urlfile&blobtable=FTB_Download&blobheader=application/pdf&blobheadername1=Content-Disposition&blobheadervalue1=document.pdf (see page 15)
[33] Ulster Bank Northern Ireland PMI September (11 October 2010) available online at: http://www.ulsterbankcapitalmarkets.com/home/Economist/NI_Economics_2/Ulster_Bank_PMI_2.aspx (see page 1)
[34] Northern Bank (18 October 2010) 'Consumer Confidence October 2010' available online at: http://www.northernbank.co.uk/SiteCollectionDocuments/economic/2010/Northern-Bank-Consumer-Confidence-Oct-10.pdf
[35] As calculated by PwC on the basis of Treasury and DFP assumptions regarding inflation rate expectations
[36] Source: figures provided to the Assembly Research Service by LPS
[37] http://www.northernireland.gov.uk/news/news-dfp/news-dfp-march-2008/news-dfp-030308-robinson-confirms-domestic.htm
[38] http://www.northernireland.gov.uk/news/news-dfp/news-dfp-february-2010/news-dfp-22022010-wilson-confirms-freeze.htm
[39] Whilst it might be argued that the economic impact would be restricted since the funds would remain within NI, and be spent therein, there is also the issue of confidence and whether increasing domestic/non-domestic rates could further constrain consumption/investment and increase precautionary saving.
[40] Northern Ireland Economic Outlook, First Trust Bank Economic Outlook and Business Review, 25 September 2010
[41] http://www.bis.gov.uk/assets/biscore/corporate/docs/s/10-1208-securing-sustainable-higher-education-browne-report.pdf
[42] http://www.hm-treasury.gov.uk/d/peowp200910.pdf (see Table 6, page 17)

9 November 2010
Budget Simulators and Participatory Budgeting
This briefing note examines the use of budget simulators by public bodies for the purpose of online budget consultation.
Budget Simulators
Budget simulators, it seems, are becoming increasingly popular with local authorities in England and Wales. An example of this can be found on the YouGov website. "You Choose" is an online budget simulator that encourages members of the public to consider where council budget cuts should fall, where efficiencies might be made, and where income might be generated.[1]
You Choose was originally developed by the London Borough of Redbridge to engage its citizens in the difficult decisions that may arise from a substantial potential reduction to its budget. In partnership with the Local Government Group and YouGov, You Choose is now freely available to all councils in England and Wales to help them engage their citizens in decisions about how they spend their revenue budgets and help them to understand the tough choices the council faces.[2]
The software contains the following spending categories (but this can be tailored to suit individual local authorities):
- community safety
- council support and public engagement
- culture and leisure
- children's services and education
- environment and waste
- housing and homelessness
- roads, planning and economy
- adult social care.
The software allows users to see the results of their proposed changes live, including the consequences of these changes in each budget area. A number of graphical presentations are also available instantly, for example, how the number of responses change over time and which are the spending categories most frequently selected for cuts. The data can also be downloaded for other sorts of analysis.
Potential users of the software are, however, reminded of its limitations:[3]
- the You Choose tool is necessarily simple (for example, not all services and not all consequences can be included) – but it does give a broad indication of which services and sources of income and efficiencies are most important to people
- the tool is most likely to be used by people with direct internet access, who are confident online and are willing to spend time giving their views – however, this does not devalue the exercise as there are ways of helping those less familiar with, or without access to, the internet.
You Choose can form part of the wider budget consultation process.
"Budget Simulator" is a similar package used by local authorities in England and Wales. It also allows users to submit their own proposed budgets and comments, and to see the consequences of their allocations.[4] The website for this product offers some useful pricing information and demos for different versions of the software.[5] The annual license fee ranges from £2,795 to £4,995, and customisation of the software is charged at £600 per day. Users of Budget Simulator include local councils and police authorities in England and Wales. Examples of applications of the software are provided on the website.[6]
One interesting application is provided by Bury Council in their 2010 budget consultation, where the Budget Simulator software is presented as a game to help people understand how budgets are set and the need to prioritise.[7]
Other councils, such as Torbay[8], the Isle of Wight[9] and Wycombe[10] have used the simulator as a tool for gathering information as part of the budget consultation process.
It is difficult to say at this stage whether or not budget simulators are successful as a consultation tool. The limitations of such an approach need to be borne in mind, both in terms of the budget information made available to users and in terms of the likely response rates for different groups i.e. to what extent might responses to such an exercise be treated as representative of key stakeholders?
Whether successful or not as a consultation tool, budget simulators appear to have the potential to promote understanding of the budgeting process and offer a means for the public to participate in the process.
Participatory Budgeting
The notion of public participation in the budget process, going beyond mere consultation, is promoted by the Participatory Budgeting Unit - a project of the charity Church Action on Poverty, based in Manchester.[11] The unit supports public sector and community groups in developing participatory budgeting processes in their local areas within the UK, and is working with the Department for Communities and Local Government in rolling out and supporting participatory budgeting pilots, going back to 2006.[12]
Broader participation in budget setting, they argue, is essential for effective, democratic and relevant local governance. The concept of "Participatory Budgeting" involves a process in which the effects of people's involvement are directly seen in either policy change or spending priorities. It is viewed not just as a consultation exercise, but an embodiment of direct, deliberative democracy.
[1] http://youchoose.yougov.com/redbridge
[2] http://www.idea.gov.uk/idk/core/page.do?pageId=22436695
[3] http://www.idea.gov.uk/idk/aio/22490373
[4] http://www.budgetsimulator.com/info
[5] http://www.budgetsimulator.com/info/pricing
[6] http://www.budgetsimulator.com/info/clients
[7]http://www.bury.gov.uk/CouncilGovernmentAndDemocracy/Councils/CouncilTaxAndFinance/budgetconsultation2010.htm
[8] http://www.budgetsimulator.com/torbay_dev
[9] http://www.budgetsimulator.com/isleofwight
[10] http://www.buckscc.gov.uk/moderngov/Published/C00000622/M00003483/AI00010703/$Budgetconsultationinfosheet.docA.ps.pdf
[11] http://www.participatorybudgeting.org.uk
[12] See http://www.participatorybudgeting.org.uk/case-studies for examples of case studies.

Paper 000/00 29 November 2010 NIAR 623-10
Resource DEL: Administrative Cost Controls
1. Background
In the context of examining efficiency savings the Committee for Finance and Personnel ("the Committee") recently called upon the Department of Finance and Personnel (DFP) "to provide a detailed analysis of administration spend by departments in 2008-09 and 2009-10."[1] This call was made in connection with expert evidence about controls to limit administration expenditure being circumvented by the reclassification of administration spend, particularly in payments to consultants.
This Briefing Note sets out the rules for, and purpose of, administrative costs limits and programme control totals within Resource Departmental Expenditure Limits (DEL). The purpose of this explanation is to point at a possible route of inquiry that the Committee, and indeed other statutory committees of the Assembly, may wish to follow with their respective departments in relation to the Budget 2010 process.
2. What are administrative cost limits?
The Executive's budget sets each department's DEL. This is divided into Capital DEL (for investment purposes such as building new hospitals and schools or office accommodation) and Resource DEL (for everything else).
Within Resource DEL there is a further control total call the 'administrative cost limit' or 'administrative budget.'
The purpose of administrative cost controls
The UK Treasury imposes administrative budgets on most departments, but not on the devolved administrations' block grants. The Executive, through DFP, also imposes such cost limits. The following extract from the Treasury's guidance[2] explains the concept concisely:
Administration Budgets cover the costs of all central government administration other than the costs of direct frontline service provision or support activities that are directly associated with frontline service delivery. In practice Administration Budgets include activities such as provision of policy advice, business support services, back-office administration of benefits, advice on and administration of grant programmes, technical or scientific support, and the work of the Government's Regional Offices.[3]
In essence, the administrative cost limits are a mechanism for controlling the cost of the administration of government rather than the delivery of services:
Although devolved administrations are not set Administration Budgets in Spending Reviews, these bodies operate their own arrangements for constraining the costs of running central government.[4]
How do they operate?
The split between administrative and programme expenditure is supposed to happen above the level of the individual civil servant; the Treasury encourages departments to classify spend at the level of business areas.[5]
Certain categories of spending fall within the administrative subset of Resource DEL. The chief components are:
- Employee costs, including civil service pay, superannuation, training, travel and subsistence;
- Current expenditure on accommodation, including rent, rates and maintenance;
- Current expenditure on office services including stationery, postage, telecommunications and computer maintenance, etc.;
- Current expenditure on comparable contracted-out services (including some consultancy costs); and,
- Depreciation charges incurred carrying out activities falling within administration costs (and where fixed assets are used for both administration and programme work these costs should be apportioned)[6]
The penultimate bullet point is important in relation to DFP's administration cost limit. Under current Treasury guidance, administration costs include:
Any costs associated with out-sourcing of support services. For example: payroll services, omnibus building service charges under PFI or other accommodation contracts, departmental switchboards, etc.[7]
Some Northern Ireland Civil Service (NICS) shared services, such as HR Connect, for example, therefore fall within DFP's control total.
The purpose of this rule is to avoid just the sort of situation referred to in the expert evidence to the Committee as part of the initial Efficiencies Inquiry; it is intended to remove any
…perverse incentive to contract out functions, or use consultants in place of civil servants, simply because the resulting work would then be charged under programme costs.[8]
Application of the controls regime
The administration cost controls regime applies to all NICS departments. It does not apply to non-departmental public bodies (NDPBs) or public corporations.
It is the responsibility of Accounting Officers for ensuring that their outturn is within the control total. Breaches of administration budgets require an explanation at year end setting out:
- The size of the breach;
- Why it occurred; and
- The remedial action that the department is proposing, including:
- Improvements in financial management to deal with the specific cause of the breach;
- Improvements in financial management to improve overall forecasting and control of the department's control totals; and,
- Information that will be provided to evidence these improvements.[9]
Changes to administration budgets
Departments may make a case to DFP if they feel that particular items of spend are being wrongly scored against administrative costs when they should be scored to programme and vice versa. An exercise to ensure that administration budgets correctly reflected departmental business was conducted prior to the preparation of the 2008-11 Budget.[10]
A recent example of a reclassification at the UK level was the movement of the Crown Prosecution Service's expenditure on the grounds that:
Public prosecution (including lawyers working in courts and counsel) represents a front line service. Prosecutors also work directly with police and other services, which are mainly funded from outside administration costs.[11]
3. Administrative cost limits for Northern Ireland Departments
In response to the Committee's request mentioned above DFP provided the following figures:[12]
Administration Costs Analysis for DFP Committee
2008-09
| Department | Budget 2008-11 Administration Costs Limit | 2008-09 Provisional Outturn |
| DARD | 46.4 | 43.8 |
| DCAL | 6.6 | 6.2 |
| DE | 19.1 | 21.6 |
| DEL | 26.8 | 24.2 |
| DETI | 17.8 | 15.7 |
| DFP | 142.8 | 165.4 |
| DHSSPS | 42.3 | 40.3 |
| DOE | 61.4 | 56.6 |
| DRD | 98.6 | 88.9 |
| DSD | 27.4 | 26.6 |
| OFMDFM | 18.3 | 16.3 |
| Total | 507.5 | 506.7 |
2009-10
| Department | Budget 2008-11 Administration Costs Limit | 2009-10 Provisional Outturn |
| DARD | 45.9 | 41.7 |
| DCAL | 6.5 | 6.5 |
| DE | 18.7 | 18.6 |
| DEL | 26.4 | 24.1 |
| DETI | 17.4 | 15.6 |
| DFP | 135.5 | 163.8 |
| DHSSPS | 41.3 | 32.8 |
| DOE | 59.5 | 56.4 |
| DRD | 96.3 | 87.6 |
| DSD | 26.7 | 26.1 |
| OFMDFM | 17.9 | 16.6 |
| Total | 492.1 | 489.7 |
The DFP tables show the limit on administration costs for each department within their resource DEL. It can be seen that – with the exception of DFP in both years and the Department of Education in 08/09 – all departments managed (in many cases comfortably) to keep within their limits.
According to DFP, its own figures are skewed following the transfer of shared services (such as HR Connect, IT Assist and so on) to it from other departments – see section on consultancy costs.
4. What use could this information be to Assembly Committees?
Much of the rhetoric surrounding the UK Government's fiscal consolidation and the consequentially reduced Northern Ireland block grant and budgets generally has featured the aim of protecting 'front line services'.[13] It is not always clear, however, what exactly is meant by 'front line services'.
A number of Assembly Committees and Members have raised this question in the past. For example, the Committee for Health, Social Services and Public Safety challenged departmental officials on the issue in October. In answer to the question, an official responded:
The simple reality is that the vast majority of health and social care is front line. The provision of health and social care is one of the few services that any society depends on for the very basics of life, including life-saving interventions, treatments and therapies that create and sustain health and well-being. All of those are front line and were recognised as such in the spending review in which the Department of Health in England secured an inflation settlement, compared to very substantial cuts in other Departments.[14]
Later in the session, the same official noted that:
Some people say that medical secretaries, for example, are not front line. However, without the medical secretaries, how do we get appointment letters out? How do we make sure that case notes get to the right out-patient clinic, and so on? We have to keep all those issues in mind as we move forward with even greater efficiencies in particular services.[15]
The ins-and-outs of this question are not for this paper to explore in depth. But purely in terms of public expenditure controls, the question should be relatively easy to answer: if individuals work in a business area whose expenditure is met from the administration budget, they are not front line.
To put this in reverse, all front line service expenditure is met from the programme element of Resource DEL. It follows that NICS departments should be able to provide Assembly Committees with information that shows which parts of their business are considered front line or back line.
A DFP official has confirmed that it would be possible for the Department to provide data that shows what percentage of the overall NICS payroll comes from the administration budget, and what comes from the programme budget, for example.[16] The official also confirmed that – as the detail of which business areas fall within which budget at departmental level is not held centrally by DFP – it would be for individual Statutory Committees to ask their respective departments for this information.
A possible purpose for requesting such information would be to support scrutiny of proposed departmental budgets as part of the Budget 2010 process. It might make it easier for Committees to provide the 'critical friend' function of scrutiny: if Members can see clearly which items of departmental expenditure are genuinely front line, they will be more able to assess the likely impact of spending reductions on particular business areas. It might allow Committees to challenge Ministers' claims that front line services are being protected.
[1] http://archive.niassembly.gov.uk/finance/2007mandate/reports/Report_60_09_10R.html (see para 114)
[2] DFP does not produce separate guidance: it applies the same control system at the local level as used by the Treasury at the national level.
[3] Treasury (2010) 'Consolidated budgeting guidance from 2010-11' available online at http://www.hm-treasury.gov.uk/d/consolidated_budgeting_guidance201011.pdf (accessed 29 November 2010) (see page 55)
[4] Treasury (2010) 'Consolidated budgeting guidance from 2010-11' available online at http://www.hm-treasury.gov.uk/d/consolidated_budgeting_guidance201011.pdf (accessed 29 November 2010) (see page 55)
[5] Treasury (2010) 'Consolidated budgeting guidance from 2010-11' available online at http://www.hm-treasury.gov.uk/d/consolidated_budgeting_guidance201011.pdf (accessed 29 November 2010) (see page 56)
[6] Treasury (2010) 'Consolidated budgeting guidance from 2010-11' available online at http://www.hm-treasury.gov.uk/d/consolidated_budgeting_guidance201011.pdf (accessed 29 November 2010) (see page 57)
[7] Treasury (2010) 'Consolidated budgeting guidance from 2010-11' available online at http://www.hm-treasury.gov.uk/d/consolidated_budgeting_guidance201011.pdf (accessed 29 November 2010) (see page 57)
[8] Treasury (2010) 'Consolidated budgeting guidance from 2010-11' available online at http://www.hm-treasury.gov.uk/d/consolidated_budgeting_guidance201011.pdf (accessed 29 November 2010) (see page 57)
[9] Treasury (2010) 'Consolidated budgeting guidance from 2010-11' available online at http://www.hm-treasury.gov.uk/d/consolidated_budgeting_guidance201011.pdf (accessed 29 November 2010) (see page 15)
[10] Source: communication with DFP
[11] Treasury (2010) 'Consolidated budgeting guidance from 2010-11' available online at http://www.hm-treasury.gov.uk/d/consolidated_budgeting_guidance201011.pdf (accessed 29 November 2010) (see page 56)
[12] DFP (27 September 2010) 'Response to Report on the Preliminary Inquiry into Public Sector Efficiencies'
[13] See, for example,: 'Education Minister announces 2010-11 Budgets' http://www.northernireland.gov.uk/index/media-centre/news-departments/news-de/news-de-april-2010/news-de-210410-education-minister-announces.htm or 'Challenging year ahead for health and social carehttp://www.northernireland.gov.uk/index/media-centre/news-departments/news-dhssps/news-dhssps-may-2010/news-dhssps-25052010-challenging-year-ahead.htm
[14] http://archive.niassembly.gov.uk/record/committees2010/HSSPS/101021_ExecutiveBudget.pdf (see pages 17-18)
[15] http://archive.niassembly.gov.uk/record/committees2010/HSSPS/101021_ExecutiveBudget.pdf (see pages 18)
[16] Source: communication with DFP

Paper 000/00 10 December 2010 NIAR 658-10
An Overview:
Ireland's Bailout and Associated Budget for 2011
1 Background
On 7 December 2010, the European Union formally approved an €85billion financial rescue plan (or 'bailout') for Ireland. This financial intervention was deemed appropriate, amidst rising yield rates[1] on Irish bonds, to safeguard the financial stability of the Eurozone. This paper summarises the key aspects of the Irish bailout, and the Government's associated recovery plans, including the Irish Budget for 2011 announced by Finance Minister, Brian Lenihan, on 7 December 2010.
2 Timeline: Ireland's road to Bailout
- Sept 2008: Lehman Brothers collapses, sparking turmoil in global financial system[2].
- Oct 2008: Irish parliament enacts legislature for a full-scale rescue of financial system, including a €400bn guarantee scheme, covering six main banks[3].
- Dec 2008: Irish government announces plan to inject €5.5bn into 3 main banks[4].
- Jan 2009: Irish government nationalises Anglo Irish, country's third largest lender[5].
- Mar 2009: Ireland's credit rating cut from AAA to AA+. Later in year it is cut to AA-[6].
- Jan 2010: Irish sovereign debt for 2009 rises to 65.5% of GDP from 44.3% in previous year.
- Mar 2010: Anglo Irish reports a loss of €12.7bn; largest in Irish corporate history.
- May 2010: IMF and eurozone countries announce €110bn bailout for Greece. A total €750bn euro bailout fund is agreed on.
- Sept 2010: Another bailout for Anglo Irish, Allied Irish and Irish Nationwide. Final bailout bill reaches €35bn, inflating the estimated budget deficit to almost 3% of GDP.
- 19 Nov 2010: Brian Cowen, Irish Prime Minister, confirms for the first time that negotiations are under way with the European Union (EU) and International Monetary Fund (IMF) on a bailout package[7].
- 28 Nov 2010: The Irish Government agrees, in principle, to accept €85bn of financial support from Member States of the European Union, through the European Financial Stability Fund (EFSF) and the European Financial Stability Mechanism; bilateral loans from the UK, Sweden and Denmark; and the IMF's Extended Fund Facility (EFF) on the basis of specified conditions[8].
- 7 Dec 2010: The EU formally approves the €85bn rescue package – this was largely a procedural step; however, a sudden change of heart could have created a panic. The plan was cleared just hours before Finance Minister, Brian Lenihan, delivered his austerity Budget outlining €6bn in tax hikes and spending cuts[9].
3 Key Aspects of the Bailout
3.1 European Union finance ministers agreed a €85 billion bail-out for Ireland on 7 December 2010, having concurred that the provision of the loan to Ireland was warranted to 'safeguard financial stability in the euro area and the European Union as a whole'[10];
3.2 According to the Irish Government, the purpose of the financial support is to return the economy to sustainable growth and to ensure a properly functioning, healthy banking system[11];
3.3 The State's contribution to the facility will be €17.5bn, which will come from the National Pension Reserve Fund and other domestic cash resources[12]. Thus the actual extent of external assistance is €67.5bn.The sources of the external support are as follows: €22.5bn from the European Financial Stability Mechanism (EFSM); €22.5bn from the International Monetary Fund (IMF); and €22.5bn from the European Financial Stability Fund (EFSF) and bilateral loans[13].
3.4 A significant part of the €85bn package (€35bn) is intended to support the banking system; €10bn of this €35bn will be used immediately to inject fresh capital to buffer the effects of expected loan losses. The remaining €25bn will comprise a contingency fund, which can be drawn upon by the banks as/when required[14].
3.5 It is worth highlighting that this €25bn fund allows for losses on buy-to-let property loans to rise to 10 per cent – double the level projected by the Central Bank under stress tests last March – and residential mortgage losses to rise from 5 per cent to 6.5 per cent. Under these higher stress test scenarios, the banks were estimated to require an additional €15bn in capital; however, the international monetary authorities insisted that an additional €10bn be set aside as a further contingency[15];
3.6 The remaining €50bn will fund the Irish Government's budgetary financing needs[16].
3.7 The funds in the facility will be drawn down as necessary; the amount used will depend on the capital requirements of the financial system, amongst other things[17].
3.8 If the total funds were drawn down with immediate effect, the combined annual average interest rate would be of the order of 5.8% per annum. The actual rate paid will depend upon when the funds are drawdown and market conditions at that time[18].
4 Some Considerations
4.1 Contagion Effect? There has been some debate around the possibility of a contagion effect, with further bailouts being required, in particular with regards to Spain and Portugal (long-term rates for Portuguese and Spanish debt have been rising, indicating that the markets are anxious about debt levels/possibility of default). This has raised the issue of whether the resultant scale of interventions could be beyond the capacity of the European Financial Stability Fund (EFSF). On the 6 December, it was reported that European Finance Ministers were debating whether the €750bn euro-zone bailout facility should be enlarged to boost confidence in the currency[19]. The comments of the EU bailout fund chief, Klaus Regling, are noteworthy in this regard:
"I sometimes hear and read that the EFSF might be insufficient, that the amount might be too small to deal with relevant cases and I think this is wrong. The amounts needed for the Irish programme, which are agreed…are relatively small compared to the lend capacity of the EFSF. The EFSF will use for Ireland much less than 10 per cent of its overall lending capacity and this implies that there are sufficient resources left to deal with other relevant cases if needed"[20]
4.2 Extent of Remaining Toxic Debt? Point 3.5 above alludes to the possibility of remaining 'toxic debt' within banks. This will be a key determinant of the scale, and associated costs, of the contingency funds drawdown by the Irish Government – essentially, this depends on whether there are remaining 'black holes' within the Irish banks. It is possible that the true extent of remaining toxicity within banks will transpire as interest rates begin to rise (an inevitable eventuality over coming years) and repayment capacity is squeezed further (artificially low interest rates may currently be masking some potential issues around repayment capacity and risk of default, for homeowners, investors, etc).
4.3 National Asset Management Agency (NAMA): As part of the bailout plan, an additional €16bn in loans (approximately 10,000 in total) will be moved to the National Asset Management Agency (NAMA) from AIB and Bank of Ireland, as the threshold for eligible loans was reduced[21]. It is unclear at this stage whether this relates to any assets in Northern Ireland – it is important that Northern Ireland's interests continue to be protected in this regard.
4.4 Growth Forecasts: As outlined in section 5.1 below, the Irish Government is expecting real GDP to grow by an average of 2.75% from 2011 to 2014. If this turns out to be excessively optimistic, (which is possible in view of the austerity measures implemented by Budget 2011; indeed it is above the expectations of the Central Bank (2.4% in 2011)[22]), the Government's repayment capacity might be stretched further.
5 Deficit Reduction Plan and Budget 2011[23]
5.1 Deficit Reduction Plan
The deficit reduction plan required for the bailout included the following measures /assumptions[24]:
- Corporation tax rate to remain unchanged at 12.5%
- €10bn (£8.5bn) of spending cuts between 2011-2014, and 5bn euros in tax rises
- Minimum wage to be cut by one euro to €7.65 per hour
- €3bn of cuts in public investment by 2014
- €2.8bn of welfare cuts by 2014, returning spending to 2007 levels
- Reduction of public sector pay bill by €1.2bn by 2014
- The reform of public sector pensions for new entrants with pay cut by 10%
- 24,750 public sector jobs to be cut, back to 2005 level
- VAT up from 21% to 22% in 2013, then 23% in 2014
- Raise an extra €1.9bn from income tax
- Abolition of some tax reliefs worth €755m
- Real GDP to grow by an average of 2.75% from 2011 to 2014
- Unemployment to fall from 13.5% to below 10% in 2014
- The introduction of domestic water charges by 2014.
5.2 Budget 2011
On 7 December 2010, Mr Lenihan announced some €6bn in adjustments to public spending in Ireland in 2011, referring to the Budget as a 'substantial down payment on the journey back to economic health'. The main points contained in the Budget 2011 include[25]:
- No reduction in the state pension;
- €10 reduction in Child Benefit rates (for first two children, with an additional €10 for the third child)
- €8 cut for social welfare, jobseekers payments
- 4c on petrol, 2c on diesel from midnight
- Revised air travel tax of €3 from March – being introduced on temporary basis, until 2011, when it will be reviewed. Mr Lenihan stressed that this should not be used as an opportunity, by airlines, to raise fees and charges[26].
- €40 payment for fuel allowance recipients
- New minimum wage not in tax net
- Public service pay will not be cut
- Public sector salary capped at €250k
- Public service pensions over €12k cut by 4%
- Taoiseach salary cut by €14k; ministers by €10k
- Next President's salary to be capped at €250k
- Employee Pay Related Social Insurance (PRSI)/health levy relief on pension contributions are being abolished.
- Income/health levies to be replaced by single universal social charge. Rates on the charge will be 0% below €4,004 a year, 2% up to €10,036, 4% from €10,036 to €16,016 and 7% above this level
- Pension contributions subject to PRSI and Universal Social Charge
- Employee PRSI contribution ceiling removed
- Increase in the PRSI rate for the self employed, higher earning public servants and office holders
- 1% tax on residential transactions up to €1m; 2% over £1m
- All stamp duty exemptions abolished
- Car scrappage extended for six months
- No change to Ireland's corporation tax rate
- Value of tax bands and credits to be reduced by 10%
- Deposit Interest Retention Tax (DIRT) rate on ordinary deposit accounts increased by 2 points to 27% and on longer-term deposits by 2 points to 30%.
- Online betting will be subject to the same betting duty as in bookie shops
- Carer's Allowance for those under 66 to be cut by €8 to €212 per week. However, allowance for people aged 66 years and over will remain unchanged[27].
- Disability Allowance being cut by €8 to €186 per week
- Business Expansion Scheme to be revamped
- 15,000 activation places for unemployed (at a cost of some €200m[28])
- Third-level student charges are to rise by €500 to €2000
- Student grants are to be cut by 4%
- New passport fees for over 65s
[1] In November 2010, the yield difference on 10 year Irish bonds versus German Bund bonds rose to 6.65%. Yield rates might be interpreted as an indicator of 'risk', including that in respect of a sovereign default, i.e. of the country being unable to honour all outstanding debts.
Ireland's road to the IMF, Financial Times, 19 November 2010
[2] Timeline: Ireland's road to the IMF, Financial Times, 19 November 2010
[3] Ibid
[4] Ibid
[5] Ibid
[6] As per Standards & Poor (S&P), the credit rating agency. Timeline: Ireland's road to the IMF, Financial Times, 19 November 2010
[7] Ibid
[8] http://www.rte.ie/news/2010/1128/govtstatement.html
[9] EU sources said the aid was not conditional on the Budget passing, but that it was 'obviously quite crucial'.
[10] http://www.rte.ie/news/2010/1128/economy.html
[11] Ibid
[12] http://www.rte.ie/news/2010/1128/govtstatement.html
[13] The bilateral loans will be subject to the same conditionality as provided by the programme.
http://www.rte.ie/news/2010/1128/govtstatement.html[14] Ibid
[15] Bailout injection to help banks sell off EUR20bn of non-core assets, The Irish Times, 6 December 2010
[16] http://www.rte.ie/news/2010/1128/govtstatement.html
[17] Ibid
[18] Ibid
[19] Ministers consider bigger EU bailout fund, The Irish Times, 6 December 2010
http://uk.finance.yahoo.com/news/U-S-back-bigger-EU-stability-reuters_molt-1992686834.html?x=0[20] Regling denies bailout fund is too small, Business World (Digest), 7 December 2010
[21] http://www.finfacts.ie/irishfinancenews/article_1021185.shtml
[22] http://imarketnews.com/node/21946
[23] http://www.rte.ie/news/2010/1207/budget2011_main_points.html
[24] http://www.bbc.co.uk/news/business-11831935
[25] http://www.rte.ie/news/2010/1207/budget2011_main_points.html
[26] http://www.rte.ie/news/2010/1207/budget_tourism.html
[27] http://www.rte.ie/news/2010/1207/budget_welfare.html
[28] Ibid

Paper 000/00 6 January 2011 NIAR 674-10
Draft Budget 2011-15
This paper presents a critical evaluation of the Northern Ireland Executive's draft Budget 2011-15. Some procedural questions are highlighted and a number of issues for further clarification are presented.
Key points
- The consultation period for the draft Budget is right at the low end of the time period suggested by good practice, and has taken place over the Christmas and New Year holiday period. This reduces the ability of the Assembly and its statutory committees, stakeholders and the general public to scrutinise the proposals and to hold the Executive to account. In effect, the Assembly has been somewhat marginalised and it is not clear that the timetable could not be extended;
- The draft Budget document does not provide full details in relation to spending/savings plans for each department. At the time of writing (6 January 2011) only four Executive departments (DCAL, DETI, DFP and DOJ) have published their own spending plans. This compounds the difficulties raised by the brevity of the consultation period as stakeholders are being consulted on partial information;
- The draft Budget makes allocations for a four-year period, with no suggestion of a formal mechanism for annual review;
- The draft Budget proposes that revenue raising options will be evaluated over the "coming weeks" but does not provide details on what those options might be, except for the introduction of a plastic bag levy and no timescale for this is provided;
- A number of other initiatives are introduced (such as Social Investment and Protection Funds) without any detail on how they are intended to operate;
- The draft Budget imposes spending reductions on the Assembly itself - and on the Comptroller and Auditor General - which are in excess of the reductions faced by Executive departments and comparable bodies in Scotland and Wales. And yet, these are the bodies which constitutionally/statutorily provide checks and balances to the Executive; and,
- The Department of Health, Social Services and Public Safety has been protected relative to other Northern Ireland departments. It has a lower proposed real-terms reduction than health in Wales, but a greater real-terms reduction than in Scotland.
1. Introduction
The Minister of Finance introduced the Northern Ireland Executive's draft Budget for 2011/12 to 2014/15 to the Assembly on 15 December 2010.
The purpose of this note is to draw out some of the key messages and to highlight some issues which require further clarification.
Timetable for consultation
The closing date for the consultation is 9 February 2011. This is an eight-and-a-half week period for members of the public, interested bodies and the Assembly's statutory committees to consider and respond to the draft budget.
Good practice suggests that 12 weeks should be the standard period for formal consultation, with a minimum period of eight weeks.[1] Whilst the consultation on the draft Budget satisfies that eight-week minimum, it should be noted that this period is over the Christmas and New Year holidays. Consequently, it is likely that Assembly committees will have only two meetings at which to consider draft Budget 2010.
Good practice on legislative budgeting suggests that:
Parliament should be allowed 2–4 months to scrutinize, debate, and propose alternative budgetary policies (within limits of cost), prior to adopting and promulgating the annual budget before the new fiscal year begins.[2]
The Executive's timeline does just about meet the lower end of the time scale suggested by the Office of First and Deputy First Minister's guidance but it falls short of that suggested by International Monetary Fund (IMF) guidance. It should also be noted that the draft Budget 2011-15 document does not contain detailed spending proposals below the level of departmental allocation. The document states that:
Ministers have been asked to publish a more detailed breakdown of proposed expenditure on their departmental websites. This should be accompanied by details of their savings delivery plans which will provide more information on the savings measures required to enable the department to live within their budget allocation. The savings delivery plans will include details of any implications for frontline services.[3]
It goes on to state that each department's consultation will run concurrently with the consultation on the overall budget. At the time of writing (6 January 2011) only four of the Executive's departments have published a consultation document on their websites. Therefore, both the public and the Assembly are being consulted on only part of the information, albeit with a promise that more will be forthcoming. The more time that elapses before this detailed information is published the less likely it is that the consultation will comply with good practice guidelines.
In the Executive's Review of Spending Plans 2010/11 a similar process was used for consultation whereby departments were to publish information on their websites. The following extract from a previous Assembly Research paper is relevant here because it appears there is a danger of similar criticisms being made again.
The approach to consultation on that occasion was criticised by The Methodist Church in Ireland's Council on Social Responsibility which in correspondence with the Committee for Finance and Personnel raised general dissatisfaction with the process:[4]
…the consultation was at best flawed and at worst opaque. The process falls far short of good practice for consultations. It is not clear how a response could be made or what the deadline is for such responses […] DFP has asked each department to publish more detailed information on its website. However, sometimes this information is not easy to locate on the websites (e.g. DHSSPS website), or when it can be located, does not contain information about what the focus of the consultation actually is or how a response can be effected (e.g. DCAL website).
The submission went on to cite a judgement by Weatherup J, handed down on 11 September 2007: "it is common ground that, whether or not consultation of interested parties and the public is a legal requirement, if it is embarked upon it must be carried out properly," (emphasis added)
In his judgement, Weatherup J cited another judgement[5] in which the four requirements of consultation were stated:
To be proper, consultation must be undertaken at a time when proposals are still at a formative stage; it must include sufficient reasons for particular proposals to allow those consulted to give intelligent consideration and an intelligent response; adequate time must be given for this purpose; and the product of consultation must be conscientiously taken into account when the ultimate decision is taken.
The Methodist Church in Ireland's Council on Social Responsibility wrote that "viewed against these requirements the current consultation falls far short […] Northern Ireland deserves better of the Executive with respect to consultation."
DFP officials were asked about the effectiveness of the consultation process on the Review of Spending Plans on 21 April 2010 in an evidence session with the Committee for Finance and Personnel. In response, an official commented:
In the responses to the draft proposals, concerns were expressed by the health and social care sector about perceived cuts. However, there were no suggestions as to, for example, if we were to take resources and allocate them to area B, which other areas should have their budgets reduced to meet the pressure. That was not explored. The other issue was pro rata cuts across Departments, as opposed to the targeted approach which the Executive decided to pursue and implement. There was no great deal of analysis or response on that.[6]
It may well be that consultees did not feel able to subject the proposals to detailed analysis simply because the information provided was in many cases insufficient for them to do so. Indeed, despite the descriptions of the documents that are available on departmental website as 'consultations' it was not clear exactly what the public was being consulted on - as noted above. It is difficult to frame a response when the question is not clearly defined."
It should be noted that at least some of the criticisms previously levelled at the approach to consultation are less valid in relation to the draft Budget. The DCAL and DFP documents do contain a closing date for comments, for example.
Legislative requirements in relation to the Budget
There is a requirement in section 64(1) of the Northern Ireland Act 1998[7] that a draft Budget must be laid before the Assembly prior to the commencement of the following financial year:
The Minister of Finance and Personnel shall, before the beginning of each financial year, lay before the Assembly a draft budget, that is to say, a programme of expenditure proposals for that year which has been agreed by the Executive Committee in accordance with paragraph 20 of Strand One of the Belfast Agreement.
Paragraph 20 of Strand One of the Belfast Agreement states:
The Executive Committee will seek to agree each year, and review as necessary, a programme incorporating an agreed budget linked to policies and programmes, subject to approval by the Assembly, after scrutiny in Assembly Committees, on a cross-community basis.[8]
It appears therefore (and this should not be construed as definitive legal advice) that the draft Budget document that was presented to the Assembly on 15 December does not discharge the Minister's duty under section 64(1) but that rather a further document that has been agreed following consultation is required. The effect of this may be to constrain any additional time available to the Executive if the Minister is to comply with his statutory obligation.
It is not immediately clear however why the Executive has chosen 9 February 2011 as the closing date for the consultation and why more time could not be given to the Assembly and other stakeholders. Considering that the draft Budget covers a four-year period, it is presumably even more important that the Assembly and other stakeholders are able to scrutinise the proposals fully than if it were a one-year plan.
An additional time constraint, however, is the coming Assembly election. The last sitting prior to the election is scheduled for 22 March 2011, so for the Minister to discharge his duty under section 64(1) a finalised Budget must be laid before the Assembly before that date.
It may be possible that there is another legislative mechanism through which more time could be sought.
For example, the Vote on Account mechanism allows the Assembly to approve a proportion of the current year's allocation to be used by departments for the following year. The Introduction to the Vote on Account 2010-11 explains:
The Vote on Account is normally calculated as a proportion (45 per cent) of the preceding year's total voted provision. Generally this should be sufficient to ensure that the provision made for each service is not exhausted before the Main Estimates can be approved in the summer, but not so high as to prejudge the Northern Ireland Assembly's consideration of the Main Estimates.[9]
The Vote on Account is usually taken at the same time as the Spring Supplementary Estimates are considered in February. It might be possible to increase the provision in the Vote on Account to a greater proportion than 45% to allow a longer consultation period. This is because the Budget itself does not confer authority on departments to spend money – that requires an Appropriation Act which accompanies the Main Estimates, usually around June.
Such an approach would not appear to solve the requirement on the Minister under section 64(1). The Committee may wish to seek legal advice on this matter.
A budget review mechanism?
The Executive has presented a four-year budget. There are some advantages in such an approach, not least that it provides certainty for departments and other stakeholders over the medium term. On the other hand, it could be argued that the approach also limits the flexibility of the incoming Executive (following the Assembly election in May) to address changing circumstances.
In its second report on the Inquiry into the Role of the Northern Ireland Assembly in Scrutinising the Executive's Budget and Expenditure, the Committee for Finance and Personnel recommended that:
Whilst it considers that the setting of a clear timetable to include key milestones at the start of each budget process is of vital importance, the Committee believes that clarity is required on the shape, frequency and duration of future budget cycles. In noting that the Budget 2010 process will develop departmental spending plans for the four-year period from 2011-12 to 2014-15, the Committee recommends that a regularised annual budgetary review process is established within this framework, with a pre-determined timetable, to enable the Executive and Assembly to make interim reappraisals of departmental allocations against progress in delivering PfG priorities and savings.[10]
The Budget document does not refer to any mechanism for an annual formalised review.
2. Departmental allocations – current expenditure
The allocations in the draft Budget for each Executive department's current expenditure are shown below in Table 1.
It should be noted that, unlike the Executive's allocation in the UK Government's recent Spending Review 2010, the figures are presented in cash terms. This means that the assumed impact of inflation for future years is ignored.
Table 1: draft allocations to Executive departments for current expenditure, in cash terms
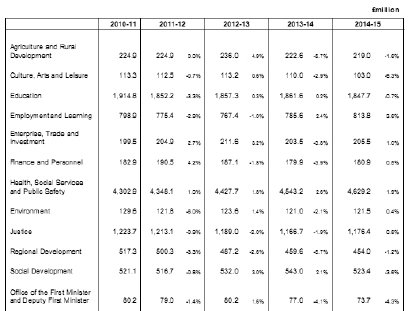
Source: Draft Budget 2011-15
In Table 2 below, the draft allocations are shown in real terms through the application of HM Treasury deflators.[11] It shows that the total planned real-term decreases for departments' current expenditure from the 2010/11 base year to 2014/15 range from 2.6% (DHSSPS) to 20.6% (DRD).
It should be noted that there are difficulties associated with considering these allocations in real terms:
- It is the cash limits that departments will have to manage; and,
- Real-terms figures are subject to the uncertainty of the future rate of inflation. For example, at the time of the Spending Review 2010, the rate of inflation for 2011/12 was forecast at 1.9%. In November, this was revised up to 2.5% (the latest deflators have been used in the calculations presented in the tables in this paper). The effect of this to reduce the assumed spending power of the Executive in future years. For example, DARD's allocation of £224.9m for 2011/12 is 'worth' £219.4m at a projected rate of inflation of 2.5% for that year. But on the basis of the forecast rate at the time of the Spending Review 2010 it would have been 'worth' £220.3m. If, on the other hand, the rate of inflation is lower than forecast, the effect would be an increase in spending power in real terms.
Table 2: draft allocations to Executive departments for current expenditure, in real terms (10/11 prices)
| £m | 10/11 | 11/12 real | 12/13 real | 13/14 real | 14/15 real | total real change 10/11 to 14/15 £m | total real 10/11 to 14/15 % change |
| DARD | 224.9 | 219.4 | 225.3 | 206.9 | 198.2 | -26.7 | -11.9 |
| DCAL | 113.3 | 109.8 | 108.1 | 102.2 | 93.2 | -20.1 | -17.7 |
| DED | 1914.8 | 1807.0 | 1773.0 | 1730.4 | 1672.3 | -242.5 | -12.7 |
| DEL | 798.9 | 756.5 | 732.6 | 730.2 | 736.5 | -62.4 | -7.8 |
| DETI | 199.5 | 199.9 | 202.0 | 189.2 | 186.0 | -13.5 | -6.8 |
| DFP | 182.9 | 185.9 | 178.6 | 167.2 | 163.7 | -19.2 | -10.5 |
| DHSSPS | 4302.9 | 4242.0 | 4226.7 | 4223.0 | 4189.8 | -113.1 | -2.6 |
| DOE | 129.6 | 118.8 | 118.0 | 112.5 | 110.0 | -19.6 | -15.1 |
| DOJ | 1223.7 | 1183.5 | 1135.0 | 1084.5 | 1064.7 | -159.0 | -13.0 |
| DRD | 517.3 | 488.1 | 465.1 | 427.2 | 410.9 | -106.4 | -20.6 |
| DSD | 521.1 | 504.1 | 507.9 | 504.7 | 473.7 | -47.4 | -9.1 |
| OFMDFM | 80.2 | 77.1 | 76.6 | 71.6 | 66.7 | -13.5 | -16.8 |
Source: Assembly Research calculations based on Draft Budget 2011-15
3. Departmental allocations – capital expenditure
The allocations in the draft Budget for each Executive department's current expenditure are shown below in Table 3.
It should be noted that, unlike the Executive's allocation in the UK Government's recent Spending Review 2010, the figures are presented in cash terms. This means that the assumed impact of inflation for future years is ignored.
Table 3: draft allocations to Executive departments for capital expenditure, in cash terms, net of capital receipts
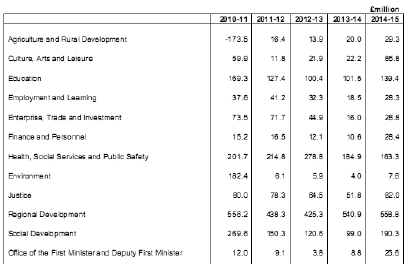
Source: Draft Budget 2011-15
In Table 4 below, the draft allocations are shown in real terms through the application of HM Treasury deflators.[12] It shows that the total planned real-term decreases for departments' capital expenditure from the 2010/11 base year to 2014/15 range from +93.1% (OFMDFM) to -96.2% (DOE).
As above, it should be noted that there are difficulties associated with considering these allocations in real terms:
- It is the cash limits that departments will have to manage; and,
- Real-terms figures are subject to the uncertainty of the future rate of inflation.
Table 4: draft allocations to Executive departments for capital expenditure, in real terms (10/11 prices), net of capital receipts
| £m | 10/11 | 11/12 real | 12/13 real | 13/14 real | 14/15 real | total real change 10/11 to 14/15 £m | total real 10/11 to 14/15 % change# |
| DARD | -173.5 | 16.0 | 13.3 | 18.6 | 26.5 | 200.0 | * |
| DCAL | 59.9 | 11.5 | 20.9 | 20.6 | 77.7 | 17.8 | 29.6 |
| DED | 169.3 | 124.3 | 95.8 | 94.3 | 126.2 | -43.1 | -25.5 |
| DEL | 37.6 | 40.2 | 30.8 | 17.2 | 25.6 | -12.0 | -31.9 |
| DETI | 73.5 | 70.0 | 42.9 | 14.9 | 26.1 | -47.4 | -64.5 |
| DFP | 15.2 | 16.1 | 11.6 | 9.9 | 25.7 | 10.5 | 69.1 |
| DHSSPS | 201.7 | 209.6 | 266.1 | 171.9 | 147.8 | -53.9 | -26.7 |
| DOE | 182.4 | 6.0 | 5.6 | 3.7 | 6.9 | -175.5 | -96.2 |
| DOJ | 80 | 76.4 | 61.6 | 48.1 | 74.2 | -5.8 | -7.2 |
| DRD | 556.2 | 427.6 | 406.0 | 502.8 | 505.8 | -50.4 | -9.1 |
| DSD | 269.6 | 146.6 | 115.1 | 92.0 | 172.2 | -97.4 | -36.1 |
| OFMDFM | 12 | 8.9 | 3.6 | 8.2 | 23.2 | 11.2 | 93.1 |
Source: Assembly Research calculations based on Draft Budget 2011-15
*Note – Calculation of a percentage change figure is meaningless where the base year (2010/11) is equal to or less than zero.
# Note – Percentage changes in allocations are presented over the four-year period for illustrative purposes. These should be interpreted with caution: the percentage change over four years can mask year-on-year fluctuations. For example, the OFMDFM allocation drops considerably for 2011/12 and 2012/13 before increasing by large amounts for 2013/14 and 2014/15.
4. Key points and issues for further clarification
4.1 Revenue raising measures – key points
- Domestic regional rate to increase in line with inflation;
- Non-domestic regional rate increase in line with inflation (with manufacturing rates to apply at 30% liability until 31 March 2015);
- Introduction of domestic water charges deferred;
- Plastic bag levy to be introduced;
- Free prescriptions retained; and,
- Free public transport for over 60s retained.
4.2 Revenue raising measures – issues for further clarification
Plastic bag levy
In his statement to the Assembly the Minister announced that the Executive has "commissioned the Environment Minister to take forward the introduction of a plastic bags levy in Northern Ireland."[13] The draft Budget 2011-15 does not provide details of the revenue-raising potential of this measure, although the Minister did refer to a figure of £4m per annum in his statement.
No timescale for the introduction of the levy was outlined.
Other revenue-raising options
The draft Budget 2011-15 refers to "other possible revenue sources that Ministers have been tasked to evaluate over the coming weeks" and then suggests that if these options are viable they will be "factored into the final budget allocations."[14] Unfortunately the document itself does not provide any further detail on what these options might be.
In his statement, the Minister did refer to "reserves held by other bodies such as housing associations, which hold reserves of over £250 million, and the Harbour Commissioners, who hold reserves of nearly £60 million."[15] He also later noted that to realise revenue from the reserves of these bodies would require legislation and that "we have not yet built into the Budget the additional money that might be available."[16]
Again, no timescale was outlined for the introduction of such measures.
This raises a further issue about the consultation process. The public and the Assembly's committees are being asked to provide views on prospective taxation measures about which they do not have any detailed information.
4.3 Reinvestment and Reform Initiative (RRI) Borrowing – key points
- The draft Budget envisages full usage of the £200m RRI borrowing facility in each of the four years; and,
- An additional £175m will be borrowed in 2011/12 if the EU approves the proposed solution to the collapse of the Presbyterian Mutual Society (PMS).
4.4 Reinvestment and Reform Initiative (RRI) Borrowing – issues for further clarification
The UK Government's Spending Review 2010 increased the cost of the Northern Ireland Executive's borrowing. Previously, the Executive was able to borrow from the Public Works Loans Board (PWLB) at 0.5% above the rate of UK Government Gilts (i.e. the rate at which HM Treasury borrows). The Spending Review however announced that the premium on PWLB loans was to increase to 1%.[17] This means that the cost of borrowing has risen at a time when the Executive is planning to rely on it more. Actual drawdown of RRI borrowing in previous years is shown in the Table below:
Table 5: draw down of RRI borrowing 03/04 to 09/10[18]
| Year | Borrowing drawn down |
| 2003/04 | £79.4m |
| 2004/05 | £168.7m |
| 2005/06 | £162.9m |
| 2006/07 | £214.6m |
| 2007/08 | £97.6m |
| 2008/09 | £16.6m (plus £243.4 m of borrowing power used to offset on balance sheet PFI projects) |
| 2009/10 | £185.3m (plus £60.7 m of borrowing power used to offset on balance sheet PFI projects) |
RRI interest repayments are to rise from £44.9m in 2011/12 to £63.4m in 2014/15 in cash terms[19] – an increase over the budget period of 41.2%. It is assumed that these interest payments are only related to the borrowing associated with capital investment and do not include any repayments that may be due for borrowing related to the collapse of the PMS as the details for the proposed scheme are as yet not finalised.
In a letter to the Committee for Finance and Personnel on 10 December 2010, the Department for Finance and Personnel (DFP) confirmed that the PMS administrator will make both the principal and the interest repayments on the loan. It is therefore anticipated that there would be no net cost to the Northern Ireland block – although this presumably assumes that the administrator is indeed able to make the repayments on time and in full.
4.5 Civil service pay – key points
The draft Budget proposes a pay freeze for all NI Civil Servants earning more than £21K per annum; and,
Those earning less than £21K will receive an annual uplift of £250.
4.6 Civil service pay – issues for further clarification
The draft Budget document states:
…civil servants obtaining pre-existing contractual entitlements to scale progression with those employees earning less than £21,000 also receiving a further annual award of £250.[20]
This seems to imply that only pay scales will be frozen above the £21K level and that civil servants will continue to receive incremental pay progression on those existing scales. It is not, however, absolutely clear that this is indeed what the Executive has proposed: the document does not state whether all civil servants have pre-existing contractual entitlements or just some.
4.7 Protection for Health – key points
DHSSPS current expenditure allocation to rise by 7.58% in cash terms over the budget period; and,
This provides "protection for the 'health' element of the DHSSPS".[21]
4.8 Protection for Health - issues for further clarification
In his statement the Minister said:
…the health budget will, I think, increase by 7% over that period. That compares favourably with the situation in Wales, where there was a 2·5% real reduction, and in Scotland, where there was a 3·03% real reduction.[22]
However, a number of points should be noted in regard to this assertion:
- The Minister was comparing a cash increase in current expenditure over a four-year period in Northern Ireland with real-terms decreases over a one-year period in Scotland and Wales;
- There is a planned reduction in DHSSPS capital expenditure of 19% in cash terms over the four-year period (see Table 3) which translates to a 26.7% reduction in real terms over the period (see Table 4) and these figures should also be factored in when considering how the proposals affect health spending;
- The planned reduction in the health budget for Scotland in real terms from 2010/11 to 2011/12 is £11,181.9m to £11,148.0m or 0.303%;[23]
- The 0.303% real-terms reduction for health in Scotland for 2011/12 includes both current and capital expenditure so this is not a like-for-like comparison with a cash increase on the current side only; and,
- If the current and capital allocations for DHSSPS are considered together (see Tables 2 and 4 above) there is a real-terms reduction from 2010/11 to 2011/12 of 1.18% - which is greater than the reduction in Scotland. It should be noted, however, that if one compares total current spending over the four-year period with the previous four-year period, there is no change in real terms.[24]
4.9 Social Investment and Social Protections Funds – key points
- Social Investment Fund of £20m established for each year of the budget period;
- This £20m is split 75/25 current/capital in 2011/12 and 50/50 in the remaining three years; and,
- Social Protection Fund established with £20m current funding for 2011/12 and unfunded thereafter.
4.10 Social Investment and Social Protections Funds - issues for further clarification
The draft Budget document provides scant detail on what either of the new Funds is designed to achieve or how they will do so. It is therefore difficult for members of the public or other interested parties to judge whether the proposals are sound or not.
4.11 Administrative cost controls – key points
- The administrative cost control regime has been abolished; and,
- The administrative cost control total within departments' Resource Departmental Expenditure Limit (DEL) will still be monitored by DFP[25] but the need for formal approval to switch resources from Programme to Administration DEL is removed.[26]
4.12 Administrative cost controls - issues for further clarification
The following extract from the Treasury's guidance explains the concept of an administration budget concisely:
Administration Budgets cover the costs of all central government administration other than the costs of direct frontline service provision or support activities that are directly associated with frontline service delivery. In practice Administration Budgets include activities such as provision of policy advice, business support services, back-office administration of benefits, advice on and administration of grant programmes, technical or scientific support, and the work of the Government's Regional Offices.[27]
The draft Budget 2011-15 document argues that:
[Abolition of administrative cost controls] will give Ministers greater flexibility to effectively and efficiently manage the resources at their disposal, with a view to maximising the outcomes achieved with such resources.[28]
It could be considered, however, that a time of public expenditure restraint is not necessarily the most appropriate time for controls on expenditure on back office functions rather than service delivery to be removed. The Budget document does not provide any detail on how the Executive proposes to ensure that departments do not unnecessarily shift resources from the front line to the back line (or indeed, the other way around).
4.13 Current to Capital switch – key points
- £252.5m switched from current expenditure to capital investment over the four-year period; and,
- Capital investment to total £1,373.8m in 2014/15 in cash terms.
4.14 Current to Capital switch- issues for further clarification
The stated aim of the Executive in relation to switching from current to capital is to protect construction jobs.[29] In evidence to the Committee for Finance and Personnel on 1 December 2010, Victor Hewitt, Director of the Economic Research Institute of Northern Ireland, made the following observation:
Be cautious on transfer — there are no free lunches in economics. You may transfer money from current to capital to preserve construction jobs, for example. However, you should not fool yourselves that removing current expenditure to help the construction industry will not have job implications: you may kill off jobs that were either directly or indirectly supported by that money.
Some construction is specialised. If you put money into road building, you may have to import labour from across the water because we do not have those skills here. It is a very delicate balance and it must be looked at in the round. An economist should never look at things in isolation; there are always implications.[30]
Colm McCarthy, University College, Dublin, also made the point in evidence on 24 November 2010 that it is possible to 'overdo' capital infrastructure investment:
It is fine to build a motorway from Dublin to Cork, but it need only be done once. There is no need to over-design and over-build roads, which we did a little bit. Some parts of the motorway network in the South were over-specified. That happened here in the 1960s, the MI to Dungannon being a case in point.[31]
On the other hand, Professor David Heald, University of Aberdeen, made the following comments on 3 November 2010:
It is very important to protect capital expenditure as much as possible. Obviously, one does not want bad capital projects — the quality of capital projects is important — but Northern Ireland is heavily dependent on the public sector and the construction sector. My understanding is that the construction sector is quite localised, so the regional multipliers in Northern Ireland will be quite high from capital spending. Therefore, one ought to think about the question of whether room can be found to move money from resource into capital.[32]
Expert opinion, therefore, seems a little divided. The Budget document doesn't contain any detail to justify the level of current to capital switch. It might be helpful to know why the Executive settled on the level of switching that it did for the draft allocations.
4.15 Invest to save – key points
- £25m per year of current expenditure set aside for invest-to-save projects; and,
- Invest-to-save funds to be allocated to departments on a 'ring-fenced' basis so they cannot be used for any purpose beyond the specified scheme.
4.16 Invest to save - issues for further clarification
The Executive established a £26m invest-to-save fund as part of its Review of Spending Plans 2010/11. In the Budget document it is asserted that projects that received allocations from this fund were successful, but no evidence is produced to support that claim. It might provide reassurance to members of the public and other interested parties if an analysis or evaluation of the 2010/11 invest-to-save funding were available to inform consideration of allocations in the draft budget: these amount to £100m in cash terms over the four-year period.
4.17 Assets realisation – issues for further clarification
There are two references in the Budget document to assets disposal. Table Two in Annex B contains a line 'Additional Capital Receipts – Central Asset Management Unit' which indicates capital receipts of £100m over the budget period. There is no further mention of the Central Asset Management Unit in the document, so it is difficult to know what these assets might be or to challenge whether the figures provided for receipts are realistic.
The second mention of assets disposal is in Table Four of Annex B which includes projections for capital receipts by departments over the budget period. There is no detail provided on what assets these forecasted receipts relate to.
5. Non-Ministerial departments
The draft Budget 2011-15 includes proposed allocations for other public bodies in addition to Executive departments. It is perhaps worth noting that the use of the phrase 'Non-Ministerial Departments' in the draft Budget is something of a misnomer. The Assembly is constitutionally separate from the Executive, not a department of it. The Comptroller and Auditor General (and so therefore the NIAO) and the other bodies listed also have separate statutory roles and independence from the Executive.
Table 6: draft allocations to Non-Ministerial departments for current expenditure, in cash terms
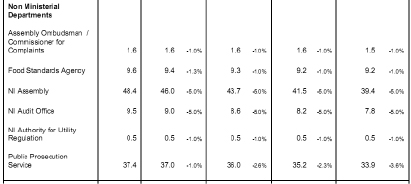
Source: Draft Budget 2011-15
In Table 7 below, the draft allocations are shown in real terms through the application of HM Treasury deflators.[33] It should be noted that there are difficulties associated with considering these allocations in real terms:
- It is the cash limits that departments will have to manage; and,
- Real-terms figures are subject to the uncertainty of the future rate of inflation.
Table 7: draft allocations to Non-Ministerial departments for current expenditure, in real terms (10/11 prices)
| £m | 10/11 | 11/12 real | 12/13 real | 13/14 real | 14/15 real | total real change 10/11 to 14/15 £m | total real 10/11 to 14/15 % change |
| Assembly Ombudsman/commissioner for complaints | 1.6 | 1.56 | 1.53 | 1.49 | 1.36 | -0.24 | -15.1 |
| Food standards agency | 9.6 | 9.17 | 8.88 | 8.55 | 8.33 | -1.27 | -13.3 |
| NI Assembly | 48.4 | 44.88 | 41.72 | 38.57 | 35.66 | -12.74 | -26.3 |
| NI Audit Office | 9.5 | 8.78 | 8.21 | 7.62 | 7.06 | -2.44 | -25.7 |
| NI Authority for Utility Regulation | 0.5 | 0.49 | 0.48 | 0.46 | 0.45 | -0.05 | -9.5 |
| Public Prosecution Service | 37.4 | 36.10 | 34.37 | 32.72 | 30.68 | -6.72 | -18.0 |
Source: Assembly Research calculations based on Draft Budget 2011-15
The Table shows that the total planned real-term decreases for Non-Ministerial departments' current expenditure from the 2010/11 base year to 2014/15 range from 9.5% (NI Authority for Utility Regulation) to 26.3% (NI Assembly).
The largest reduction in real terms for current expenditure of the Ministerial departments is 20.6% (DRD) (see Table 2 above) – a smaller reduction than that indicated for the NI Assembly.
Yet on 8 November 2010 the Assembly resolved:
That this Assembly notes with concern the likely reduction in the block grant that will be brought about by the comprehensive spending review; and calls on the Assembly Commission to reduce its running costs in line with the level of reduction faced by Executive Departments.[34]
On an initial reading it appears that the Executive has gone against the wishes of the Assembly as expressed in the resolution and decreased the NI Assembly allocation in excess of that faced by Executive departments, rather than in line with them.
A very similar level of real-terms reduction (25.9%) has also been proposed for the NI Audit Office (NIAO). It should be noted, however, that section 65(3) of the Northern Ireland Act 1998 (c.47) provides that:
The Comptroller and Auditor General for Northern Ireland shall not, in the exercise of any of his functions, be subject to the direction or control of any Minister or Northern Ireland department or of the Assembly[35]
The role of Executive departments in relation to the NIAO is limited under section 66(3) of that Act to the provision of advice by DFP to the Assembly's Audit Committee.
Under Article 6(2) of the Audit (Northern Ireland) Order 1987[36] it is the Assembly's Audit Committee which has the statutory role of approving (with or without modification) the Comptroller and Auditor General's resource requirements for a given financial year. This estimate must then be laid by the Audit Committee before the Assembly.
For the purposes of comparison, the proposed allocations for equivalent bodies in Scotland and Wales may be of interest:
Table 8: proposed allocations for Scottish Parliament, Welsh Assembly and Northern Ireland Assembly and associated audit bodies, in cash and real terms (10/11 prices).
| £m | 2010/11 allocation | 2011/12 proposal | 2011/12 real terms | cash terms % change | real terms % change |
| Scottish Parliament and Audit Scotland | 98.7 | 95.9 | 93.6 | -2.84% | -5.17% |
| Welsh Assembly Commission and Auditor General | 54.0 | 54.2 | 52.9 | +0.0037% | -2.04% |
| Northern Ireland Assembly and NIAO | 57.9 | 55.0 | 53.66 | -5% | -7.32% |
Sources: Assembly Research calculations based on Draft Budget 2011-15, Welsh Assembly Government final budget 2010/11[37] and draft Budget 2011/12[38], Scotland's Spending Plans and draft Budget 2011/12[39]
One final point which is relevant to consideration of the Northern Ireland Assembly Commission's budget allocation is that Commission agreed a real-terms reduction of 13.3% over the four years.[40] The Scottish Parliament Corporate Body's proposal for the period is to achieve a 12% real-terms reduction over the period.[41] The National Assembly for Wales Commission has similarly proposed a real-terms reduction of 12% over the period.[42]
[1] OFMDFM (2003) 'A practical guide to policy making in Northern Ireland' available online at: http://www.ofmdfmni.gov.uk/practical-guide-policy-making.pdf (accessed 20 December 2010) (see section 8.5)
[2] International Monetary Fund Technical Notes and Manuals (2010) 'Role of the Legislature in Budget Processes' available online at: http://www.imf.org/external/pubs/ft/tnm/2010/tnm1004.pdf (accessed 20 December 2010) (see page 5)
[3] NI Executive (2010) 'Draft Budget 2011-15' available online at: http://www.northernireland.gov.uk/website_-_draft_budget.pdf (accessed 20 December 2010) (see page 30)
[4] This section is extracted from Assembly Research paper 45/10 available online at: http://archive.niassembly.gov.uk/researchandlibrary/2010/4510.pdf (accessed 5 January 2011) (see page 14)
[5] Ex p Coughlan [2000] 3 All ER 850, [2001] QB 213, para 108
[6] Official Report Committee for Finance and Personnel 21 April 2010, available online at: http://archive.niassembly.gov.uk/record/committees2009/FinancePersonnel/100421Reviewof2010-11SpendingPlans.pdf (accessed 27 April 2010) (see page 5)
[7] Available online at: http://www.statutelaw.gov.uk/content.aspx?LegType=All+Legislation&title=northern+ireland+act&Year=1998&searchEnacted=0&extentMatchOnly=0&confersPower=0&blanketAmendment=0&sortAlpha=0&TYPE=QS&PageNumber=1&NavFrom=0&parentActiveTextDocId=2045126&ActiveTextDocId=2045214&filesize=808 (accessed 5 January 2011)
[8] Available online at http://www.nio.gov.uk/agreement.pdf (accessed 5 January 2011)
[9] http://www.dfpni.gov.uk/ni-estimates-vote-on-account-2010-2011.pdf
[10] CFP (2010) 'Second Report on the Inquiry into the Role of the Northern Ireland Assembly in Scrutinising the Executive's Budget and Expenditure' available online at http://archive.niassembly.gov.uk/finance/2007mandate/reports/Report_66_09_10R.html#3 (accessed 22 December 2010) (see Recommendation 4)
[11] Available online at http://www.hm-treasury.gov.uk/data_gdp_fig.htm (accessed 20 December 2010)
[12] Available online at http://www.hm-treasury.gov.uk/data_gdp_fig.htm (accessed 20 December 2010)
[13]Official Report 15 December 2010 available online at: http://archive.niassembly.gov.uk/record/reports2010/101215.pdf (see pages 180-181)
[14] NI Executive (2010) 'Draft Budget 2011-15' available online at: http://www.northernireland.gov.uk/website_-_draft_budget.pdf (accessed 20 December 2010) (see page 23)
[15] Official Report 15 December 2010 available online at: http://archive.niassembly.gov.uk/record/reports2010/101215.pdf (see pages 187)
[16] Official Report 15 December 2010 available online at: http://archive.niassembly.gov.uk/record/reports2010/101215.pdf (see pages 189)
[17] HM Treasury (2010) 'Spending Review 2010' available online at: http://cdn.hm-treasury.gov.uk/sr2010_completereport.pdf (accessed 22 December 2010) (see page 50)
[18] Source: communication with DFP
[19] NI Executive (2010) 'Draft Budget 2011-15' available online at: http://www.northernireland.gov.uk/website_-_draft_budget.pdf (accessed 20 December 2010) (see page 51)
[20] NI Executive (2010) 'Draft Budget 2011-15' available online at: http://www.northernireland.gov.uk/website_-_draft_budget.pdf (accessed 20 December 2010) (see page 24)
[21] NI Executive (2010) 'Draft Budget 2011-15' available online at: http://www.northernireland.gov.uk/website_-_draft_budget.pdf (accessed 20 December 2010) (see page 51)
[22]Official Report 15 December 2010 available online at: http://archive.niassembly.gov.uk/record/reports2010/101215.pdf (see pages 187)
[23] Scottish Executive (2010) 'Scotland's Spending Plans and Draft Budget 2011-12' available online at: http://www.scotland.gov.uk/Publications/2010/11/17091127/9 (accessed 20 December 2010) (see Table 8.02)
[24] Source: Assembly Research calculations
[25] Communication with DFP official
[26] For more information on the Administrative Cost control regime, see Assembly Research Briefing Note 192/10, available online at: http://archive.niassembly.gov.uk/researchandlibrary/2010/19210.pdf
[27] Treasury (2010) "Consolidated budgeting guidance from 2010-11? available online at http://www.hm-treasury.gov.uk/d/consolidated_budgeting_guidance201011.pdf (accessed 29 November 2010) (see page 55)
[28] NI Executive (2010) 'Draft Budget 2011-15' available online at: http://www.northernireland.gov.uk/website_-_draft_budget.pdf (accessed 20 December 2010) (see page 29)
[29] NI Executive (2010) 'Draft Budget 2011-15' available online at: http://www.northernireland.gov.uk/website_-_draft_budget.pdf (accessed 20 December 2010) (see page 28)
[30] Official report available online at: http://archive.niassembly.gov.uk/record/committees2010/FinancePersonnel/101201SpendingReviewandBudget.pdf (accessed 21 December 2010) (see page 7)
[31] Official report available online at: http://archive.niassembly.gov.uk/record/committees2010/FinancePersonnel/101124SpendingReviewandBudget2011-15.pdf (accessed 21 December 2010) (see page 40)
[32] Official report available online at: http://archive.niassembly.gov.uk/record/committees2010/FinancePersonnel/101103Spending_Review_and_Budget.pdf (accessed 21 December 2010) (see page 3)
[33] Available online at http://www.hm-treasury.gov.uk/data_gdp_fig.htm (accessed 20 December 2010)
[34] Official Report available online at: http://archive.niassembly.gov.uk/record/reports2010/101108.pdf (accessed 21 December 2010) (see page 197)
[35] http://www.statutelaw.gov.uk/content.aspx?LegType=All+Legislation&title=northern+ireland+act&Year=1998&searchEnacted=0&extentMatchOnly=0&confersPower=0&blanketAmendment=0&sortAlpha=0&TYPE=QS&PageNumber=1&NavFrom=0&parentActiveTextDocId=2045126&ActiveTextDocId=2045215&filesize=4440 (accessed 21 December 2010)
[36] http://www.statutelaw.gov.uk/content.aspx?LegType=All+Legislation&title=audit+(northern+Ireland)+order&Year=1987&searchEnacted=0&extentMatchOnly=0&confersPower=0&blanketAmendment=0&sortAlpha=0&TYPE=QS&PageNumber=1&NavFrom=0&parentActiveTextDocId=2910280&ActiveTextDocId=2910291&filesize=5136 (accessed 4 January 2011)
[37] http://wales.gov.uk/docs//finance/report/091201finalbudgeteng.pdf (accessed 5 January 2011)
[38] http://wales.gov.uk/docs/finance/report/101117gowamotionen.pdf (accessed 5 January 2011)
[39] http://www.scotland.gov.uk/Publications/2010/11/17091127/18 (accessed 5 January 2011)
[40] Source: communication from NI Assembly Clerk/Director General 9 December 2010.
[41] Source: letter from the Presiding Officer to the Convenor, Finance Committee 16 November 2010, available online at: http://www.scottish.parliament.uk/corporate/anrep-accts/spcb/20101116OUTSPCBBudgetSubmission2011-12.pdf (accessed 6 January 2011) (see page 3)
[42] National Assembly for Wales (2010) 'Assembly Commission Budget 2011-12' available online at: http://www.assemblywales.org/bus-home/bus-guide-docs-pub/bus-business-documents/bus-business-documents-doc-laid/gen-ld8316-e.pdf?langoption=3&ttl=GEN-LD8316_-_National_Assembly_for_Wales_Assembly_Commission_Budget_Proposals_2011-12 (accessed 6 January 2011) (see page 8)

19th January 2011
Preventative Spending
NIAR 19/2011
This paper examines the case for early intervention strategies which are designed to reduce the demand for more expensive intervention or treatment at a later date.
Research and Library Service briefings are compiled for the benefit of MLAs and their support staff. Authors are available to discuss the contents of these papers with Members and their staff but cannot advise members of the general public. We do, however, welcome written evidence that relate to our papers and these should be sent to the Research & Library Service, Northern Ireland Assembly, Room 139, Parliament Buildings, Belfast BT4 3XX or e-mailed to RLS@niassembly.gov.ukKey Points
- Northern Ireland is one of the most socially and economically deprived regions of the UK. The cycle of deprivation is a long-standing intractable problem with this generation of economically inactive currently raising the next.
- Preventative spending is often more valuable during a recession because people are forced to make cuts in their standard of living which has a detrimental impact on their own well being and the prospects for the next generation.
- The demand for public services is projected to rise significantly as a result of negative social problems.
- The current allocation of resources into expensive short-term treatments when there are cost-effective long-term solutions is dynamically inefficient.
- There is not a consensus on how programmes of preventative spending ought to be immediately financed. Nor is there consensus that in every case an increase in spending is required.
- Government departments suffer from 'silo' budgeting and are not sufficiently prepared to spend money on an issue when benefits/savings are realised by other departments.
- Measuring the effectiveness and efficiency of preventative spending is difficult given that:
- Preventative measures are not 100% effective;
- Social outcomes are insufficiently recorded;
- Other influences may add or detract from a campaigns effectiveness;
- External benefits are often gained by others indirectly; and
- Benefits may be unquantifiable.
- Only 1% of the NHS budget is currently spent promoting health.
- £7.5m was spent in Northern Ireland in 2009 treating drug and alcohol addiction.
- Crime cost the Northern Ireland economy £2.9bn per year in addition to wider immeasurable social costs.
- Studies show that many home modifications and social service interventions are cost-effective when compared to residential care.
- Evidence suggests that preventative spending programmes, when targeted at the early years (0-3) age group are some of the most effective in delivering long-term savings.
- Studies indicate that for every £1 spent on early years education, you must spend £7 to have the same impact in adolescence.
Executive Summary
This paper provides a summary of a body of research compiled by the Scottish Finance Committee (SFC) during its inquiry into preventative spending and also includes a number of additional relevant sources. This paper outlines the case for preventative spending, the barriers to implementation, the methods of application and also includes a range of case studies.
Definition
Preventative Spending is, 'a clinical, social, behavioural, educational, environmental, fiscal or legislative intervention or broad partnership programme designed to reduce the risk of mental and physical illness, disability or premature death and/or to promote long-term physical, social, emotional and psychological well being' (Arbuthnott, 2010).
Case
For various reasons public services have been designed to react to problems rather than proactively prevent problems from developing at an early opportunity. Although for over a decade public expenditure has been increasing, evidence suggests that as a result of negative social outcomes (such as a poor diet and crime) the demand for services has also been rising. This increase in public expenditure failed to tackle negative social outcomes which, commentators assert, sustain this demand. At the current juncture, demand is projected to continue to increase while public spending is being cut as a result of the banking crisis.
Deprivation is often inherited by the children of the deprived. We measure deprivation in monetary terms, however it must be recognised that this form of measurement is imperfect. Although levels of economic and social deprivation are often correlated, compared to 50 years ago in real terms each person in the UK is on average more than two and a half times wealthier and yet deprivation is still a distinct problem in society (The Guardian, 2010). Today Northern Ireland is one of the most economically deprived regions of the UK. Each year we spend a significant amount of money treating the outcomes associated with deprivation rather than on preventative solutions aimed at breaking the cycle.
Barriers to Implementation
Problematically preventative spending is difficult to implement. The benefits are accrued in the medium to long-term and preventative spending often generates widespread external value, both of which are difficult to measure. There is always an element of uncertainty that a preventative spending campaign could be ineffective and/or inefficient as the benefits are intangible and the adoption of the policy is usually based on the results of a similar campaign in a different location. Political will is required and some may consider early intervention politically intrusive. Moreover, an upfront source of government revenue may be required for funding.
Early Years
Evidence suggests that the most effective preventative spending is that targeted at the 0-3 early years age group. Examples include:
- Antenatal health promotion;
- Additional maternity care; and
- Parenting classes.
Evidence shows that 95% of a child's brain development occurs during this period and these years are deemed crucial for ensuring that children are properly prepared to start formal education. Targeting preventative spending at this age group is in many cases the most cost-effective form of preventative spending because significant realised benefits multiply throughout a child's life and can be achieved for a relatively small initial investment.
Health Care
Preventative measures are already an integral part of the health care system. Nevertheless health professionals such as Dr. Alan Maryon-Davis, president of the UK faculty of Public Health, contend that the UK spends an insufficient amount on prevention across the board. In the last few decades, a number of costly preventable illnesses such as diabetes and mental ill health have become much more prominent in society. Significant savings could be made if the prevalence of these illnesses in particular could be curtailed. A recent study by the University of Queensland and Deakin University in Australia outlined the cost-effectiveness 150 different preventative health care strategies. The study found that many of these measures were indeed cost-effective.
Policing and Justice
Policing and justice is a costly, reactive way to deal with crime. The social characteristics of prisoners highlight that crime is connected to deprivation. For these reasons a body of evidence suggests that the best type of prevention is dealing with the problem of deprivation. In Scotland Detective Chief Superintendent John Carnochan took a forward thinking joined-up approach to tackling crime when he diverted additional resources into early year's services. Both the Justice Reinvestment Programme in Texas and the Restorative Justice programme in the UK were examples of two successful preventative spending schemes which demonstrated the potential ways to save money through rehabilitation.
Application
Throughout the inquiry into Preventative Spending by the Scottish Finance Committee there was a recurring message which highlighted the need to define the desired outcomes of service delivery. Advocates contend that services can lose their value if delivered as an end in itself rather than a means to an end. Three ideas for financing preventative spending were identified:
- A proportional shift in the emphasis of spending towards prevention;
- Greater use of 'pooled' cross departmental budgets; and
- Frontloading investment with the use of social impact bonds.
The current cost benefit analysis method used to evaluate investment was identified as inadequate and a number of alternatives such as such as the Social Return on Investment (SROI) were suggested. It was also identified that the macroeconomic model fails to adequately account for resulting multidimensional benefits of preventative spending. In addition, lowering bureaucracy, increasing information sharing between departments and increasing the quality of staff were all identified by organisations as important for ensuring the successful application of programmes.
Conclusion
The need for preventative spending is the result of market failure and there is a great deal of evidence which suggests that our current allocation of resources is dynamically inefficient. A change in mindset is required if preventative spending is to be enacted. Additionally, cross-departmental partnership and joined up government are the required foundations for preventative spending interventions. Spending is not always required to enact prevention. For example, increasing the effectiveness of public services will help to ensure that, within the established framework, intervention occurs at the earliest point at which people make contact with public services. In addition, with a creative mindset, there are a wide range of preventative policies which could be developed that do not require financing. In most cases the government is in the most advantageous position to make the most sizeable impact.
Contents
Key Points
Executive Summary
1. Introduction
2. What is the case for Preventative Spending?
3. Do we spend enough on prevention?
4. Children and Early Years
4.1 Case
4.2 Return on Investment
5. Health Care
6. Alcohol and Drugs
7. Policing and Justice
8. Domestic Violence
9. The Elderly and Disabled
10. Application
10.1 Measurement
10.2 Economic Modelling
10.3 Bureaucracy and Information Sharing
10.4 Staff
10.5 Finance
11. Conclusion
12. Recommendations
Annex 1: UNICEF Child Wellbeing Ranking
Annex 2: Children and Early Years
Annex 3: Health Care
Annex 4: Drugs and Alcohol
Annex 5: Policing and Justice
Annex 6: Social Services and Domestic Violence
Annex 7: The Elderly and Disabled
Annex 8: The Application of Preventative Spending
1. Introduction
Preventative Spending is, 'a clinical, social, behavioural, educational, environmental, fiscal or legislative intervention or broad partnership programme designed to reduce the risk of mental and physical illness, disability or premature death and/or to promote long-term physical, social, emotional and psychological well being.'
(Arbuthnott, 2010)
We all have been exposed to measures of prevention; smoking cessation campaigns for example. Nevertheless, when Northern Ireland is compared to other societies (such as those in Scandinavia) it is apparent that the concept of prevention is less well incorporated into government policy. As a result our public services have been designed to react to the consequences of negative social pressures rather than in a proactive way to prevent the initial emergence of these pressures.
The Finance Committee in the Scottish Parliament began an inquiry into preventative spending in September on the basis that during a time of fiscal consolidation long-term preventative action should, 'not be forgotten' (Burnside, 2010). This inquiry has demonstrated how widely preventative spending has been researched and highlighted the wealth of tried and tested effective and efficient examples that are available upon which preventative policies could be designed. This paper will summarise this evidence.
2. What is the case for Preventative Spending?
'Recent research by UK think tank the new economics foundation identified the UK to be the lowest in Europe in spending on almost every preventable social problem including crime, mental ill health, drug use, obesity and family breakdown. As a result we, as a nation, spend a third more on addressing the consequences.'
(Scottish Parliament, 2010)
It is well known to policy makers that Northern Ireland is one of the most socially and economically deprived regions of the UK. It is also widely accepted that this cycle of deprivation in Northern Ireland has been a long-standing intractable problem with this generation of economically inactive currently raising the next.
Indeed the UK is recorded as having one of the lowest levels of social mobility out of 12 countries measured by the OECD (2010, p. 7). During their time in office at Westminster Labour administered the biggest increases in public spending for decades. Nevertheless, commentators contend that the reactive nature of our public services means that much of this increase was spent dealing with the consequences as a result of social ills rather than resourcing necessary long-term solutions to break the cycle of deprivation.
Going forward, the demand for public services is set to rise further and it is estimated that, 'If current inefficient spending continues the cost to the UK economy of dealing with social problems such as family breakdown, mental ill-health and drug abuse could reach as much as £4 trillion over the next 20 years. (Action for Children, 2009). This figure excludes other increasing pressures on our public services such as additional demand for healthcare much of which is attributed to rapid increases in those suffering from diabetes (Connor, 2009). The table below (provided by Action for Children, 2009) shows that the UK currently fares poorly compared to our European counterparts:
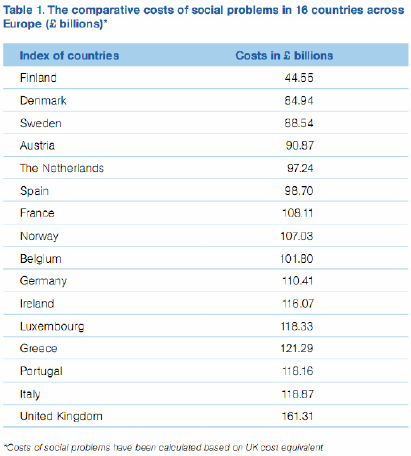
During its inquiry, the Scottish Finance Committee (SFC) has taken evidence from a wide body of individuals and organisations who have attested evidence to show that real and lasting savings are possible if government were to follow a preventative spending approach. This report will detail some of this evidence and provide examples of successful preventative spending campaigns in other jurisdictions.
'Can we afford to invest; can we afford not to invest?'
(Action for Children, 2009)
3. Do we spend enough on prevention?
It is impossible to prove that preventative spending is in every case an efficient use of government resources. Indeed, some campaigns of preventative spending are more effective than others and some may be completely ineffective. Before discussing preventative spending more specifically, the following reasons detail some of the barriers to implementation:
The benefits of current spending are accrued in the medium to long-run:
- Benefits in their entirety from a current campaign are only fully realised in the medium to long-term.
- There is therefore less incentive to make current 'intangible' investments with long-term prosperity in mind against investments which provide current 'tangible' benefits.
Preventative spending often generates widespread external value:[1]
- For example, effective rehabilitation for alcoholics generates positive value for society: rehabilitated alcoholics will add more social value to their family in their role as a parent. This is outside the direct positive economic benefits such as maintaining a steady job and paying taxes to the government.
- Government departments suffer from 'silo' budgets and are ill prepared to spend money on an issue when the benefits/savings are realised by other departments or by society as a whole.[2] Negative social consequences can be thought of like a sink of dirty dishes in a shared house where no individual is willing to do the job because it is thought of as everybody else's responsibility (Alan Sinclair in Burnside, 2010).
Measuring the effectiveness and efficiency of preventative spending can be difficult:
- Preventative spending is not 100% effective. Those who are not impacted by preventative measures are often much more visible than those who have been impacted.
- Campaigns of preventative spending have different effects when used in different social and cultural settings. A successful campaign in France may not have the same effect locally.
- Other influences on peoples' lives add or detract from the effectiveness of a specific campaign. E.g. Operating a healthy eating campaign may prove ineffective at cutting levels of obesity if individuals at the same time cut the amount of time they spend exercising.
- With long-term and wide ranging external benefits quantitative cost benefit analysis often fails to properly measure the unquantifiable benefits which are the result of preventative spending. This could include, for example, higher self esteem, greater community cohesion and inter-generational learning
Political arguments:
- Some for political reasons contend that there is too much government interference in individuals' lives. Nevertheless an inefficient allocation of resources into preventative spending will mean that individuals will pay more tax as a result of poor decisions that others make.
Government revenue is required:
- For all of the reasons outlined above, it can be politically difficult for government to justify and raise revenue for preventative spending purposes.
- Although efficient preventative spending would entail that across the entire economy total benefits will be higher than total costs, the automatic benefit to the public purse (in terms of resulting higher tax revenue) may not be sufficient to offset the costs.
4. Children and Early Years
'If the race is already halfway run even before children begin school, then we clearly need to examine what happens in the earliest years.'
Professor Esping-Anderson in Melhuish P. E., 2010
'Like it or not, the most important mental and behavioural patterns, once established, are difficult to change once children enter school.'
Nobel Peace Prize winning economist, James Heckman in Melhuish P. E., 2010
A great body of the evidence presented to the SFC has focused on early years interventions, reflecting a belief that the greatest impact can be achieved at this with preventative spending targeting this age group. Advocates contend that social investments made in this age group provide the highest rate of return on investment in human capital (Wilson, 2010).
In 2007 the UNICEF placed the UK amongst the ex-Soviet states and near the bottom of the international rankings for child well being (See: Annex 1). Northern Ireland fares particularly poorly. Over one third of children live in poverty compared to 14% of children in England. Northern Ireland has a higher rate of children on the child protection register: 38 per 10,000 children compared to 22 Scotland, 24 England and 33 in Wales (Save the Children, 2010; Barnados, 2008). Mirroring the UK's poor performance in child well being, the country experiences, 'some of the worst social outcomes - such as crime, mental ill health and drug use - across Europe' (Action for Children, 2009).
Advocates of early intervention contend that the correlation between poor upbringing and negative social outcomes is not coincidental. This correlation is shown in the evidence presented by Aberlour Childcare in Scotland (2010):
- Over one quarter of inmates prisons have been in care.
- Over 20% of 16-19yr olds designated as NEET (not in education, employment or training) are recent care leavers.
- 65% of care leavers fail to attain a basic English and Maths qualification.
- Only 3% of care leavers go on to gain any higher education qualification.
Although parents are trusted with the responsibility to raise their children, the cost of neglect in this regard is borne by society. Studies show that one generation of 16-18yr old NEET will cost society £31bn over their lifetime and education underachievement costs the UK £18bn per year (Nottingham City Council, 2010; Niven, 2010). Recent statistics for Northern Ireland show that between 2000 and 2009, during a period of economic growth, the problem amplified with the number of young people classified as NEET doubling to 52,000 (Kelly, 2010). Recent research by the London School of Economics suggests that when lost productivity is included, each job seeker costs up to £16,000 per year (Prince's Trust, 2010).
Philip Wilson, a senior lecturer on infant mental health at the University of Glasgow detailed an example illustrating the reactive nature of public services for children. Wilson stated that public services tend to prioritise other shocking forms of child abuse over neglect, even though neglect is a much greater social problem: 'The fact that at least 60,000 children in Scotland are living with problem drug or alcohol use in the family yet only 2,000 are subject to child protection procedures, is testament to the fact that we are failing to protect the most vulnerable children' (Wilson, 2010).
4.1 Case
Early years advocates contend that the cycle of deprivation starts even before a child is born. Dr. Jonathan Sher from Children in Scotland outlined the importance of the health of the mother during pregnancy and the problems following from with heavy smoking, drinking or obesity at the time of conception. These problems, he said, were very difficult to reverse during pregnancy and result in defective birth outcomes which place a significant long-term strain on the public purse. Two effective examples of ante-natal preventative measures were mentioned during the inquiry:
- Folic Acid Supplements: These inexpensive nutritional supplements when taken before conception reduce the change of spina bifia and other defects by up to 70% (Sher, 2010).
- Foetal Alcohol Syndrome: 'Parental exposure to alcohol is the leading cause of brain damage and developmental delay amongst children in industrialised countries.' Yet, stopping all alcohol consumption during pregnancy is 100% effective in preventing foetal alcohol syndrome (Children in Scotland, 2010).
Following birth, breastfeeding was identified as another effective measure of prevention. Breastfeeding was identified as providing lifelong health benefits, both to the mother and child.[3] Evidence from the WHO was presented which estimates that if all children were exclusively breastfed until the age of 6 months and then supplemented with food until the age of 2, the lives of 1.5m children would be saved globally (Hosking & Ita, 2010).
The UK performs poorly in this regard with less than 1% of mothers exclusively breastfeeding at 6 months compared to the EU average of 28% (Hosking & Ita, 2010). Reflecting this Sweden was identified as an example of good practice, where the infant mortality rate of 2.5 per 1000 births is less than half that in the UK (Hosking, Finance Committee Official Report, 2010). In addition to significantly more women choosing to breastfeed, Sweden was also identified by Hosking as offering women higher quality ante and post natal care (2010):
- Maternity care services are accessed by 99% of pregnant women, who typically have 11 individual contacts with those services, mostly midwives.
- 98% of all maternity health care clinics offer parenting education to first time parents.
- 99% of families make use of child health care services and on average have 20 individual contacts with those services, primarily nurses.
- 8-10% of midwives time is spent receiving training in parenting education which includes regular professional training from psychologists.
'There are no bad parents, only untrained parents... No one taught me to be a parent. When I had my three children, I did what most people do: I copied my own parents. That is fine for those who had good parenting, but those who did not tend to replicate the cycles of abuse and violence.'
(Hosking, Finance Committee Official Report, 2010)
The availability and uptake up of high quality parenting education in Sweden was identified as another measure of effective prevention. Evidence shows that 95% of brain development occurs between birth and age 3 and during this time parents have the responsibility to ensure that many important skills are developed such as language, listening and behaviour (Hosking, Finance Committee Official Report, 2010).
11.5% of children in the UK start school without the behavioural skills they need and are subsequently more likely to drop out of the education system (NESTA, 2010). Moreover school un-readiness was identified as having negative effects on the other children in classroom. This was highlighted in a study into the performance of children in Switzerland, Slovenia and England (Hosking, 2010). This study identified variations in the academic ability of children when starting school as the principle reason why children in Slovenia and Switzerland had caught up and outperformed English children even after starting school at a later date.
Language is one of the most crucial elements of a child's development at this age and language delay has been identified as a highly sensitive marker of child neglect. (Over 80% of preschool children in care have language delay) (Wilson, 2010). Moreover, 'reading to a child regularly at 3 years old was estimated to be twice as important as family income for a child's development at age 5' (Oxfam, 2010).[4] Once again research suggests that the UK performs poorly compared to Europe. At 30 months 10% of children in Scotland were identified as having some degree of language delay, double the rate compared to Sweden (Wilson, 2010).
These figures above are indicative of poor parenting.[5] Research also highlights as a consequence of poor parenting children are more likely to develop early violent behaviour, leading to their involvement in crime in the future. For example, it is estimated, that, untreated, 40% of children with early behavioural difficulties go on to develop conduct disorder (Hutchings, 2007). Subsequently, 40% of 8 year olds with conduct disorder are repeatedly convicted of crimes such as theft vandalism and assault in adolescence (NES Psycology, 2010).
Research indicates that this behaviour starts at a very early age. Oxfam states that, 'nurses could identify an at-risk group who, by the age of 21 had committed more crime, were more likely to abuse their partners and have antisocial personalities.' This claim was also made by WAVE; 'at 3 years old the 17% most violent children (who may account for 50% or more of future crime) are showing levels of aggression 10 times higher than the most peaceable 3%' (Hosking & Ita, 2010).[6] Many of these children belong to the most vulnerable group, which amounts to less than 1% of the general population. According to WAVE this 1% provides one third of the prison population and have two and a half times the national average of teenage pregnancies (Hosking & Ita, 2010). This cycle is then repeated: daughters of teenage parents are three times more likely to become teenage mothers, and 65% of sons with a convicted father go on to offend themselves (Nottingham City Council, 2010).
4.2 Return on Investment
'There is robust evidence that expenditure in the preschool years gives the highest rate of return on investment in human capital'
(Wilson, 2010)
Dr Zeedyk and other advocates for early year's intervention contend that the preventative spending which targets the early years is so successful because it has the potential to influence brain development (Zeedyk, 2010). Graph 1 below submitted to the SFC by Prof. Edward Melhuish shows the current disparity between brain development and public spending (Melhuish P. E., 2010):
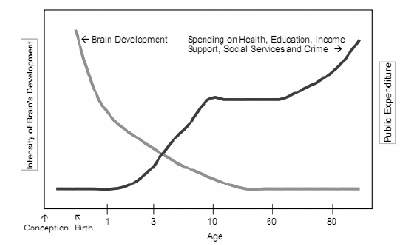
A body of evidence presented to the SFC attests that early years intervention is a cost-effective approach. Prof. James Heckman calculates that for example that for every £1 spent on early years education, you must spend £7 to have the same impact in adolescence (Violence Reducation Unit, 2010). A further advantage of early intervention is that the benefits continue to be realised into the future. The table below details examples:
Table 2: Potential Monetary Savings (or costs) from Affected Child Outcomes
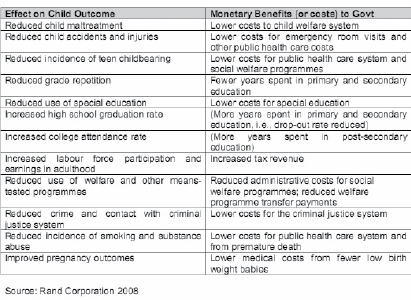
The following examples outline the return on investment by various organisations:
- Oxfam calculate that £1 invested in intensive tuition programmes for those with the lowest level of ability in literacy would save £12 - £19 in the future (Oxfam, 2010).
- A US version of sure start demonstrated that for every $1 spent, $7 was saved from the cost of criminal justice and welfare systems later in life (Oxfam, 2010).
- £1 invested in action for Children's targeted services produced between £7.60 and £9.20 in benefits to society (Action for Children, 2009).
Additionally, A study conducted by PriceWaterhouseCoopers in 2004 calculated that, 'expanding free Early excellence centres services for 2,3 and 4-year-olds in Britain and improving the quality of ECE services by upgrading the skills of the workforce, would result in a 1-2% increase in GDP through higher rates of maternal employment and increased lifetime employment. Mitchell et al. comment that this estimate may have been substantially higher had PriceWaterhouseCoopers also considered social benefits, such as the impact on income distribution, child poverty, remedial education, improved health or lower crime rates' (Oxfam, 2010).
Graph 2 below illustrates the return on investment from intervention:
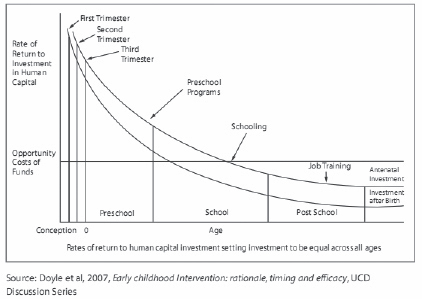
Although there was a near universal acceptance regarding the importance of early years intervention, evidence by the YMCA, Scotland contested the consensus on the completion of brain development between the ages of 0-3. The YMCA claims that there is recognition that there is an important process of refinement in brain development called synaptic pruning which continues throughout the teenage years. They contend that because of this process, if young people continue to live in an environment of suspicion, repression and futility, the circuits that are confirmed during the teenage years will be those that are most appropriate to survival in such an environment. This evidence, they claim, demonstrates the importance that youth in their adolescent years are not disregarded (YMCA, 2010).
See Annex 2 for relevant case studies.
5. Health Care
Savings in the cost of future healthcare offer some of the clearest examples of the costs associated with reactive public spending. As technology advances it is becoming increasingly possible to identify the root causes of many illnesses and treatment which is administered at the earliest possible opportunity is more than often the most cost-effective approach.
In 2009, Dr Alan Maryon-Davis, president of the UK faculty of Public Health made an appeal to policy makers to think twice about cutting preventative programmes during times of financial austerity; it would be 'sheer short-sighted folly' to cut back on programmes which help prevent chronic conditions and which currently only constitute 'a paltry' 1% of the NHS budget (Maryon-Davis, 2009). Maryon-Davis maintains that what is required is to move from what he described as an unsustainable 'national illness service' to more of a 'national health service.'
This call seems particularly applicable to Northern Ireland as the IPH predicts that chronic diseases such as hypertension, coronary heart disease, stroke and diabetes are likely to dramatically increase in the future (Institute of Public Health, 2010). Moreover, NHS studies show that people living in more deprived areas suffer from worse health when compared to others (NHS Wales, 2004).
Diabetes provides a striking example which illustrates cost of preventative inaction. New cases have increased by 74% between 1997 and 2003 (Connor, 2009) and the between 2000 and 2030 the WHO expects this number to rise further from 1,765,000 to 2,668,000 (2010).[7]
The rise in the prevalence of the disease has been mirrored by an unsustainable surge in the demand for treatment and the subsequent costs borne by the NHS. Although doctors contend that the increase in diabetes is the result of poor diet and lack of exercise across society, only a fraction of the cost of treatment is actually spent on preventative measures.[8] Aside from the impact on well being and quality of life, the long-term economic costs to society are evident: diabetes treatment now consumes 10% of the total NHS budget, an increase of 5 percentage points in 6 years (BBC News, 2004; Diabetes.co.uk, 2010).
Smoking remains a costly and intractable problem for society. Analysis from the US estimates that for every smoker who dies from a smoking attributable condition, another 20 experience smoking-attributable illnesses such as chronic bronchitis and emphysema (ASH, 2010). Smoking is estimated to cost the NHS over £5bn per year and total societal costs of smoking amount to 13.74 billion annually, nearly 4bn more than the government recovers in tobacco duties (Press Association, 2009).[9]
65% of smokers start when they are under 18 and 40% start when they are under 16 (ASH, 2010). 26.7% of the UK population are classified as daily smokers. This is a relatively high figure compared to some other European countries such as Portugal (16.5%) and Sweden (17.5%), for example (Eurostat 2009). ASH contends that preventing young people starting to smoke remains the best and most cost-effective form of treatment.
According to evidence, the cost of treating mental ill health is another example of where the government has the potential to make long-run savings. To provide an example of the scale of the costs related to mental ill health, Graph 3 below breaks down the spending by primary care trusts in England and Wales in 2006:
Across the UK and in 2010, the annual cost to the NHS of mental ill health has increased to £28bn per year with the wider cost to society is estimated at £105bn per year (Yew, 2010). This includes the cost to the economy from sickness absence and unemployment plus the financial burden the illness places on families. Indeed, 1 in 4 people will suffer from mental ill health at some point in their life and mental illness accounts for more disability adjusted life years lost per annum than any other health condition (NHS, 2010; McBride, 2010).
In 2006 a BBC Newsline investigation revealed that in Northern Ireland 1000 young people were on a waiting list to see a psychiatrist and some had been waiting for over 2 years. 'This was despite the fact that the province has one of the Europe's worst suicide rates and the UK's highest levels of mental illness' (Mills, 2006). Yet, across the UK, only £2m is spent on prevention and alleviation such as promoting self esteem and coping skills (Yew, 2010). Experts such as Bob Grove from the Centre for Mental Health and Andrew McCullough from the Mental Health Foundation contend these figures are indicative of a failure to tackle the root causes of mental health problems and provide cost-effective treatment of individuals at an early stage (Yew, 2010).
See Annex 3 for relevant case studies.
6. Alcohol and Drugs
The costs of alcohol and drugs are well documented, with negative spill over effects aside from direct healthcare costs. This includes, for example, the costs borne by social services from associated child protection issues and the cost to the justice department in tackling drug and alcohol related crime.
In the UK the average person consumes 11 litres of pure alcohol per year. When contrasted to Sweden (where the same figure is 7 litres per year) it is no surprise that in an OECD report on drunkenness in 24 countries the UK was found to be the worst (Hosking, 2010). In terms of healthcare alone, the Royal College of Physicians and NHS confederation have described the growth in the cost of alcohol related treatment to £2.7bn per year as, 'unsustainable' (BBC News, 2010).
Between 1998 and 2008 Addaction state that the use of illegal drugs also cost the UK £10bn in healthcare costs as well as £100bn as a result of related crime (Addaction, 2008). Moreover, each person who remains dependent on illegal drugs costs the country £44,000 a year. In 2009, £7.5m was spent in Northern Ireland treating drug and alcohol addiction (Belfast Telegraph, 2010).
The Serenity Cafe (a project which facilitates people recovering from addiction in Scotland) describes addiction as a, 'long-term chronic neurobiological disorder that has genetic, phycosal and environmental dimensions' (2010). They contend that whilst it can be treated relapses can be frequent.
Some studies suggest as few as 3% of people sustain abstinence after drug treatment programmes, while American studies suggest that average relapse rates after drug and alcohol treatment are around 60%. The Serenity Cafe suggests that greater expenditure on prevention could reduce the costs which are a consequence of addiction. On better treatment mechanisms the organisation advocate allocating a small percentage of spending towards what is termed recovery capital. This they contend would help to increase the numbers who achieve long-term sustained abstinence.
See Annex 4 for relevant case studies.
7. Policing and Justice
'We need a good and effective criminal justice system that will stabilise the patient, but the cure must happen far earlier than our involvement does'
Detective Chief Superintendent John Carnochan,
Scottish Violence Reduction Unit (2010)
'Holland has a similar economy to ours, and it gives support for the very early years—during pregnancy and the first months and two or three years of life. it is really interesting to see that Holland, which has possibly the best early years or child performance in the whole of Europe, is now selling its prison space to Belgium, which has one of the worst such performances'
Alan Sinclair,
Centre for Confidence and Well-being (2010)
It costs in excess of £80,000 per year to keep an individual locked in jail Northern Ireland and each new prison place in the UK is estimated to cost £119,000 (NI Assembly, 2009; Marsh, 2008). Resolving a murder in the UK costs an estimated £1m and estimates suggest 2.5bn is spent treating the outcomes of violence each year in England and Wales (Violence Reducation Unit, 2010).
In Northern Ireland, crime costs the economy £2.9bn per year in addition to wider immeasurable costs (Belfast Telegraph, 2010). £90m per year is spent on legal aid with more than 60% of this money spent on criminal cases (Kearney, 2009). However, after all this expense, 'three quarters of offenders return to crime' (BBC News, 2010). Although the number of prisoners in Northern Ireland fell during the 1990's, since then it has been rising and now stands at 1,528 (Prison Service, 2010).
The social characteristics of prisoners are outlined in Table 3 below:
It is clear that the characteristics in this table not only define the prison population but are the very characteristics which harness the development of criminals. Commentators such as Detective Chief Superintendent John Carnochan of the Violence Reduction Unit maintain that a cost-effective long-term approach involves tackling the development of these characteristics at an early stage. Indeed Carnochan put these words into practice. Following a reduction in murders in Strathclyde he requested that the money the unit saved from reducing the murder rate be allocated into early years services (Zeedyk, 2010).
Effective rehabilitation of offenders is another possible preventative spending approach. Whilst the balance between justice and rehabilitation must be struck, spending on the effective rehabilitation of criminals can help to ensure that:
- Others do not fall victim to crime from released offenders; and
- More money is not spent by the tax payer jailing repeat offenders.[10]
A study by the Centre for Criminal Justice Economics in the University of York points out that for every $1 spent on prison, only $0.24 to $0.36 is saved on avoiding offending. This contrasts to spending on probation, which delivers $1.70 in benefits for every dollar spent (McDougall, Cohen, Swaray, & Perry, 2010).
See Annex 5 for relevant case studies.
8. Domestic Violence
A study by Sylvia Walby estimated that domestic abuse cost England and Wales £23bn in 2004 (Zero Tolerance, 2010). This included direct costs of £6bn and emotional costs of £17bn. One in 4 women will experience domestic abuse from a partner in her lifetime and the cost to the public purse of violence against women in all its forms is estimated to be almost double this figure at £40bn (Zero Tolerance, 2010). The UK Corporate Alliance against Domestic Violence estimates that domestic violence currently costs UK business over £1.9 billion a year (Zero Tolerance, 2010).
In Northern Ireland cases of domestic abuse are reported on average every 21 minutes (Belfast Telegraph, 2010). 11,000 children are directly affected by domestic abuse and the cost to the local economy is estimated at £180m per year (Devaney, 2009). Almost 2000 of the recorded 9,903 domestic abuse crimes in 2009 -10 were perpetrated against men (PSNI, 2010).
Two examples of cost-effective preventative interventions were provided by Zero Tolerance and demonstrate the possibility of significant savings (2010):
- The 1994 Violence Against Women Act in the USA has resulted in an estimated net benefit of $16.4 billion, including $14.8 billion in averted victim's costs.
- Providing shelters for victims of domestic violence resulted in a benefit to cost ratio between 6.8 and 18.4. .
See Annex 6 for relevant case studies.
9. The Elderly and Disabled
With disability and ageing there are many associated costs. Some of these costs along with possible potential savings were identified by The Scottish Federation of Housing Association (2010) for the SFC.
The organisation identified that the average cost to the state of a fractured hip is £28,665, which is 4.7 times the average cost of a major housing adaptation (£6,000) and 100 times the cost of fitting hand and grab rails to prevent falls. For a seriously disabled wheelchair user, the cost of residential care is £700-£800 a week or £400,000 in 10 years, but providing adaptations and equipment that enables someone to move out of a residential placement produces direct savings, normally within the first year. Home modifications can also help to prevent or defer entry into residential care for older people. One year's delay will save £26,000 per person, less the cost of the adaptation (average £6,000). An hour's home care per day costs £5,000 a year. Moreover, adaptations that remove or reduce the need for daily visits pay for themselves in a time-span ranging from a few months to three years and then produce annual savings. In the cases that the organisation reviewed, annual savings varied from £1,200 to £29,000 a year.
One of the biggest challenges facing Western society is the cost associated with dementia. 1 in 3 people aged over 65 in the UK will die with dementia and this year the global cost of the disease is expected to exceed 1% of world GDP. Experts warn that dementia is, 'the greatest health and social crisis of the century' (Roberts, 2010).
Scientists have yet to find a cure for dementia, a good diet, regular exercise, mental activity and social engagement have all been shown to slow the onset of the disease (Hill & Reiss, 2008). For these reasons in Australia the government has initiated a campaign entitled 'Mind Your Mind' in order to raise awareness and encourage Australians to reduce their risk of developing the disease (Alzheimer's Australia, 2010).
Dementia costs the UK £23bn per year (more than cancer and heart disease combined), yet it receives a fraction of the funding. 'Researchers calculated that for every pound spent on dementia studies, £12 was spent on investigating cancer and £3 on heart disease' (Sturcke, 2010).
See Annex 7 for relevant case studies.
10. Application
Throughout the inquiry by the SFC there was one particular recurring message, applicable to the entire concept of preventative spending:
'The whole mindset seems to be that the local authority is there to offer services and processes, not to produce better outcomes'
(Hosking, Finance Committee Official Report, 2010)
'I passionately believe that we have to refocus on people rather than process'
(Decon, 2010)
'If funding where truly related to "outcomes" rather than "outputs", as it should, then thinking outside the box would encourage budget holders within different public bodies to share their resources more freely'
(Independent Living in Scotland Project, 2010)
'Building services around people not agencies'
(Birmingham Total Place Pilot, 2010)
'Culture eats strategy for breakfast. Until we get the culture right, no strategy will work'
(Watson, 2010)
10.1 Measurement
Throughout the inquiry a number of organisations highlighted the inadequacy of current measurement tools. Dr. Rosemary Geddes from the Scottish Collaboration for Public Health Research and Policy outlined how local authorities in Scotland can chose a range of measurement indicators from a menu of 52 and can make up some of their own if they like. This proved problematic because such a system makes it difficult to measure what is going on in the entire country. (Geddes, 2010)
Action For Children stated that current policy tools, 'restrict investment decisions being made beyond their narrow financial return, making it difficult to identify needs and gaps in services to make our investments count.' The call for more effective indicators was echoed by Jenny Kemp from Zero Tolerance and WAVE; 'Inadequate measurement and policy evaluation tools restrict investment decisions being considered beyond their financial return to the state and mean public services are led more by cost efficiencies, not by public benefit' (Hosking & Ita, 2010).
The following measurement recommendations were made:
- Action for Children and WAVE advocate replacing conventional cost benefit analysis with the Social Return on Investment (SROI) indicator. SROI attempts to measure the wider public benefit of investment, which is often not counted using conventional measurements. This can be thought of as the benefits to society that are generated by a service and can include economic savings to the public purse but also some less tangible benefits that are important for how people experience their lives (Hosking & Ita, 2010; Action for Children, 2009).[11]
- WAVE recommends that new measures of societal progress be established. These would act as a mechanism to better value children and young people as 'public goods', through the introduction of National Accounts of Child Well-being. (Hosking & Ita, 2010)
- Barnados and Save the Children contend that measurements based on longitudinal research are the most effective when used to measure outcomes (Barnados Scotland, 2010; Save the Children, 2010).
10.2 Economic Modelling
Action for Children identified failings in the economic model used by society. The 'narrow definition' of societal progress 'fails to account for the multidimensional nature of child well-being or the value of 'good childhoods'. Moreover, they contend that an economic model showing how a transition towards a more preventative system could be achieved in practice is lacking (Action for Children, 2009).
10.3 Bureaucracy and Information Sharing
The constraint that bureaucracy places on effective service delivery was another theme throughout the inquiry. For example, Ann Houston from Children 1st stated that the level of regulation has served to divorce community members from the protection of children (2010).
Susan Deacon, an appointee of the Scottish government reported that, '£450m a year was spent by Scotland's charities and third sector organisations purely on reporting back to their funders; somewhere in the region of 5 % of their funding went on producing multiple reports and multiple evaluations' (Deacon, 2010).
Information sharing in Nottingham's early intervention project was described as the 'single biggest issue' (Curryer, 2010). Curryer further highlighted the problem of 'Professional snobbery,' where one domain believes their particular way of operating is superior. Nevertheless, Curryer also believes that through having all agencies strongly endorse Nottingham's early intervention project, 'the number of bureaucratic issues reduced considerably' (2010).
10.4 Staff
Poor quality staffing was identified by WAVE as a factor which detracts from the effectiveness of service delivery for children. Analysis by WAVE shows that the following characteristics for staff in care homes accounted for nearly 30% of the variation in reported rates of pregnancies in under-19-year-olds:
- Higher rates of in-service training
- Offered more fact-seeking responses to hypothetical dilemmas involving young people
- Intended to carry on in their current post for longer.
John Carnochan from the Violence Reduction Unit identified that though nursery school staff have the most optimal potential to make the greatest impact on a child's development, yet those in the profession were, 'some of the lowest paid and least valued' (Carnochan, 2010).
WAVE suggests that one of the ways the UK could improve the delivery of early years services is if staff had better qualifications. Table 4 below outlines the qualifications of staff from a study comparing England, Denmark and Germany (Hosking & Ita, 2010).
| Qualification | England (%) |
Germany (%) |
Denmark (%) |
| Low | 8 | 0 | 0 |
| Medium | 36 | 45 | 3 |
| High | 20 | 51 | 94 |
| Other childcare qualification | 0 | 2 | 0 |
| None/no relevant qualification | 36 | 2 | 3 |
| Total | 100 | 100 | 100 |
WAVE found that 'it took almost double the staff-to-children ratio to deliver poor results in England than those who delivered medium results in Germany and very good results in Denmark.'
WAVE also advocates an expansion in the study of social pedagogy, which is a popular and established degree course on the continent. The organisation contends that a greater understanding of this holistic approach would be particularly suitable for meeting children's needs in residential care. This echoes a 2009 House of Commons committee report which stated We urge the Government to think broadly and creatively about the possible future applications of the social pedagogy approach in the care system….' (Hosking & Ita, 2010).
10.5 Finance
'Money gravitates to problem management and not problem solving'
(Watson, 2010)
There is not a consensus on how programmes of preventative spending ought to be immediately financed. Nor is there is there a consensus that in every area an increase in spending is required.[12]
The ideas for financing include:
- A proportional shift in the emphasis of government spending towards preventative programmes, with the savings increasingly reinvested in preventative schemes.
- Greater use of 'pooled' cross departmental budgets set aside to tackle issues (utilised both in Birmingham and Nottingham).
- Frontloading social investment with the issue of social impact bonds.
Action for Children have carried out significant analysis work on the latter idea. In their 'Backing the Future' report the organisation calculates that UK-wide investment of £191 in targeted interventions coupled with a £428bn investment in universal childcare and parental leave would provide savings of £486 billion over 20 years.
'Using bonds to finance investment is not a new idea. Previous work on the Social Impact Bond has been carried out to provide a new way of investing money in social outcomes. The idea is that investments can be made by commercial investors, foundations or governments into programmes of work that seek to improve the lives of a group of people (e.g., young people at risk of unemployment or offending). Not only would this bond provide a safe investment opportunity, it would also provide an opportunity for financial investors and regular citizens (e.g., through pension funds) to invest in the future of their society. This provides people with the opportunity to realise both a financial and a social return on their long-term investments' (Action for Children, 2009). A case study located at Annex 7 details the introduction of social impact bonds in Peterborough.
Save the Children (2010) assert that any financial investment ought to achieve cross party budgetary support. This is because measuring the impact of programmes requires a time frame in the medium-long-term time which is longer than the budget period. The organisation also advocate that the government, rather than the voluntary sector is best placed to deliver sustained investment on the scale that is required. This is because government services (such as schools) have the infrastructure already in place to reach large numbers of people.
Faced with a zero-sum decision some witnesses such as George Hosking from WAVE (2010) and Professor Edward Melhuish (2010) stated that money would be better spent if it were shifted from tertiary education into early years and primary education.
See Annex 7 for relevant case studies which detail the application of preventative spending.
11. Conclusion
The need for preventative spending is the result of market failure. A body of evidence as presented in this paper suggests that our current allocation of resources into expensive short term treatments when there are cost-effective long-term solutions is dynamically inefficient. This evidence also outlines that preventative spending programmes when targeted at the early years age group are some of the most effective in delivering long-term savings. It follows that any benefits gained in the early years will have a multiplier effect throughout a child's life, which will offer wider external benefits to the rest of society. Successful early years intervention will also increase the equality of opportunity and improve intergenerational justice in society. In addition, other research, such as that on preventative health by ACE, demonstrates that in many other areas preventative spending can lead to real savings.
Across the board advocates contend that a change in mindset is required if preventative spending is to be truly effective. Cross-departmental partnership and joined up government is often necessary and investment (such as that in preventative health care) will require a recognition that government sometimes knows best.[13] As it stands, faced with the current incentive structure, many individuals make poor choices that lead to a detrimental impact on their health and a cost for the public purse.
Arguably during a recessionary period preventative spending is even more important than during a period of growth. Unemployment caused by a recession will force people to make cuts to their standard of living which has a detrimental impact on their own well being and the prospects of the next generation. The lack of opportunities for young people may lead them to an increased number becoming involved with drugs or caught in a life of crime, for example. Reducing preventative spending which may be part of a framework of support for those most disenfranchised in society at the time when demand for support is at its highest may add to the downward recessionary spiral.
It is important to recognise that prevention does not in every case require spending. For example, faced with budget constraints the following are example ideas of measures, which could still be considered:
Taxation and Minimum Pricing
This can be used to create incentives and raise revenue with the effect of promoting a healthy lifestyle. E.g. junk food tax or minimum alcohol price.[14]
Effectiveness and Output
Increasing the effectiveness and output of public services can effectively increase investment in the social economy, and as a consequence public services become more efficient. The following are examples:
- Decreasing bureaucracy, thereby increasing front-line services
- Targeted education initiatives in schools e.g. healthy-eating campaigns, fitness campaign, health and safety courses, parenting classes and/or drug awareness.
- Increased affordable-use government facilities for groups e.g. community centres and schools.
- Targeted initiatives by public servants e.g. community workers organising additional events for the elderly.
- Increasing training/education requirements for nursery and care workers.
Legislation and Regulation
Examples include:
- Increasing alcohol and cigarette sales regulation.
- Regulating salt levels in food.
- Increasing the quality of school dinners.
- Restricting portion sizes.
- Prohibiting the marketing of children's toys next to unhealthy fast food.
Working Hours
- Decreasing working hours of public servants rather than reducing staff levels. This would increase the time workers have available to care for children and elderly.
- Extending working hours of nursery and school teachers. This would have the effect of increasing their effectiveness and also decreasing childcare costs for parents.
- Increase maternity and/or paternity leave.[15]
Culture
Promoting a public service culture of information sharing and multi-agency approaches to problems
Welfare and Benefits
Although requiring a relatively small amount of government investment, spending a little money in order to increase benefit take up could produce noticeable benefits, particularly during the recession. As payments are paid by central government, spending money to ensure that more people claim the benefits they are entitled to will amount to a fiscal injection into the local economy. This could be achieved, for example, by increasing awareness and the assistance available to people. An increase in benefit take up will in turn will have a multiplier effect and help local businesses. It will also ensure those least well off in society have access to entitlements which will therefore decrease demand on public services.[16]
12. Recommendations
In light of the findings from this study, it is recommended that preventative spending is featured in the Committee's scrutiny of the Draft Budget 2011-15.
Annex 1: UNICEF Child Wellbeing Ranking
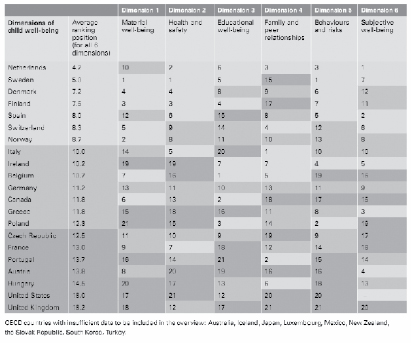
Annex 2: Children and Early Years
There are many examples of successful of early year's preventative spending programmes. The WAVE trust has outlined 47 such studies from around the world which can be found in the annex of their 2010 Early Intervention Report at:
http://www.wavetrust.org/WAVE_Reports/WAVE_Trust_International_Early_Intervention_Review_2010.pdf
The Netherlands (Burnside, 2010)
The most recent UNICEF study of child wellbeing in OECD countries ranks the Netherlands as the highest scoring for child wellbeing, with the UK at the bottom of the table (UNICEF 2007 – see Annex 1). This case study looks at some of the early year services in place in the Netherlands.
There are several key messages about how parent support is conceptualised; viewed in policy terms; and implemented in practical programmes.
Firstly, there is an overall national policy framework which supports families through universal provision of health, education and welfare services (including benefits) as well as support activities. The policy agenda is the responsibility of the Ministry for Children which introduced a strategic plan for children and families. This includes extending Children and Family Centres to every neighbourhood (to be set up by the 530 local authorities but bringing public and voluntary sectors together).
The 12 regional authorities are responsible for implementing and funding specialist Youth Care Agencies as a single point of access for all children and carers with pressing problems or enquiries. Parent support programmes are based on positive prevention and problem intervention. The preventive approach is used more with parents of younger children and the problem focus for parents of older children and young people, although there is an increasing emphasis on improving more general support for all families. Many programmes are adapted from UK and US programmes but there are distinctive approaches such as supporting ethnic minority groups or encouraging readiness for school.
Kraamzorg (Maternity Nursing Care)
'Kraamzorg' is one of the key support programmes for new mothers in the Netherlands – for both first time and subsequent births. It is significant that this system of support has been in place for decades and is taken for granted by Dutch families as a high quality service which everyone would use. Essentially, the system is designed to support families in the period immediately after birth – for up to ten days – or longer where it is needed. A major difference from the support offered by midwives in the UK is that there is a cadre of trained professionals who are NOT midwives but have their own status as maternity carers who look after mothers and new babies – AND other members of the family including fathers and other children. Their main focus is on settling in the baby and mother to family life and they help with breast feeding, bathing and routines for the baby, looking after the mother's personal care needs as well as offering social-emotional support and advice; and in cases where it is needed, preparing meals for the rest of the family and generally keeping the household running. Families can choose whether they wish to have an all-day service or a part-time service with two visits per day – a long visit of several hours in the morning and a pop-in visit later in the day. Any strictly medical problems are referred to a health professional such as a GP or midwife. It is partly because of this kind of support that the Netherlands maintains its reputation for safe home deliveries and also widespread use of the 'polyclinic' where women go into hospital only for the actual birth of the baby and return home in a matter of hours. The emphasis is on childbirth as a part of family life, not a medical condition, except in cases of specifically identified need. As a universal service, there is no stigma attached and mothers from all walks of life are very positive about the help they have received from this service.
The Consultatiebureau (Mother and Well-Baby Clinic)
Following on the immediate support after birth, there is a well established network of clinics where families can have their babies' development monitored and receive advice on general issues about feeding, growing and stimulating as well as dealing with any problems which arise.
It says something of the atmosphere created by the professionals in the clinics and general attitudes in Dutch society that something like 97% of families make use of these services, and it is only in cases where there may be other problems that they are not taken up. The issue of accessibility does not arise.
The 'Brede School' (Community Schools)
The concept of the Brede School is rather different from that of the community school in the UK. It is based more on the idea of a one stop centre promoting the co-operation of all services dealing with children and families with schools as the lead agency. In this regard, Brede Schools are more akin to the aims of the development of integrated children's services, as opposed to schools which provide out-of-school activities generally aimed at involving young people in leisure activities. The aim is that this co-operation should result in improved growth and development of children and young people. It has been part of the range of provision in different places since 1998 and is based mainly in primary schools.
Each programme is different as they are intended to be responsive to local needs, taking into account what parents and children themselves want. Other partners include the pre-schools, social welfare agencies, sports programmes, child public health and arts organisations, for example. Target groups for the broad range of activities on offer include children and young people, parents, neighbours, volunteers and other community groups with their own particular interests.
The USA
It may be easier to evaluate specific examples of preventative spending in the USA as many have been implemented in isolation in a society where preventative spending is the exception rather than the norm.
Harlem Children's Zone Project (Hosking & Ita, 2010)
This programme is focused on 97 blocks of the very disadvantaged community of central Harlem. The method is described as a Project Pipeline, delivered in stages to cover all children's ages from zero through to college. Initially, parents and potential parents attend Baby College where they learn parenting skills. The programme also includes a fitness and nutrition centre which offers free classes to children in karate, fitness and dance and where participants learn about health and nutrition and receive regular academic assistance. Statistics from the baby college show that:
- 371 individuals graduated in 2009.
- 86% of Baby College parents who read to their children less than 5 times a week at pre-test, improved their frequency.
- 92.5% of respondents said they had learned a lot from the classes.
Examples of the programme's achievements:
- Of the 161 four-year-olds entering the Harlem Gems in 2008-2009, 17% had a school readiness classification of 'delayed' or 'very delayed'. By the end of the year, there were no students classified as 'very delayed' and the percentage of 'advanced' rose from 33.5% to 65.2%, and those at 'very advanced,' rose from 2%. To 8.1%.
- Since their creation in 2004 and 2005, Promise Academy I and II elementary schools did so well that leading Harvard economist Roland Fryer concluded that the students had actually closed the black-white achievement gap.
- In 2009, the third-graders from both schools were 100 percent on or above grade level in the state-wide maths programme.
- At PA1 the third-graders were 94 percent on or above grade level in English Language Arts, while the third-graders at PAII were at 86 percent.
- Part of the afterschool programme is a chess programme: one team finished second and two other teams came in third in the All Nationals for Girls in 2009 (in all the chess programme served 106 children throughout HCZ who went on to win 78 trophies).
- In 2008-2009, the programme's karate team brought home 86 trophies, including 36 first-place trophies.
High Scope/Perry Pre-School Project (Hosking & Ita, 2010; HighScope, 2010)
These programmes which commenced in the 1960's form part of most internationally renowned research studies on early year's provision. At ages 3 and 4, children from disadvantaged backgrounds were randomly divided into a program group of 123 children that received a quality preschool program based on HighScope's participatory learning approach and a comparison group who received no preschool program. This involved highly trained teachers delivering the programme five half-days per week, with one 90-minute weekly home visit.
By the age of 27 the long-term benefits of this programme were evident with improvements in: school dropout rates, rates of drug use, teenage pregnancy rates, employment, welfare dependency, and crime rates. In addition, a follow up of the individuals on the programme once they had reached 40 showed that they were less likely to have been arrested and those who graduated from high school earned more than those who had not participated in the programme – particularly men.
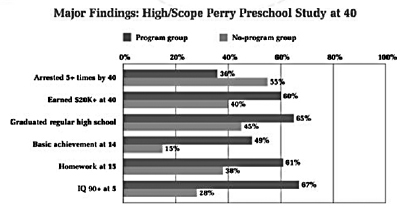
Triple P: South Carolina (Hosking & Ita, 2010)
The Positive Parenting Programme ('Triple P') is a behavioural family intervention based on social learning principles and is now used widely in a range of countries. It is a programme known for its standardised training and accreditation processes. Providers reported delivering the intervention to between 8,883 and 13,560 families over a 2-year period.
The programme is delivered to parents rather than to children, and is based on five core parenting principles:
1. Ensuring a safe and engaging environment for children.
2. Creating a positive learning environment for children.
3. Using assertive discipline.
4. Having realistic expectations, assumptions and beliefs about the causes of children's behaviour.
5. The importance of parental self-care.
Triple P works at 5 levels (from community-based to a narrow targeted focus). From a policy-making perspective, and particularly in relation to inequalities, division into 5 delivery levels of increasing intensity is key:
- Level 1: population level for all interested parents of children 0-16 years (promotion of parenting style through media, parenting tip sheets, TV programmes, newspaper columns, radio announcements etc).
- Level 2: brief early intervention strategy for parents of children with mild behavioural/developmental issues. Delivered through primary care services (1-2 consultation sessions, tip sheets, videotaped programmes).
- Level 3: more intensive early intervention strategy, targeting parents of children with mild to moderate behavioural/developmental difficulties (involves 4 sessions providing active skills training for parents).
- Level 4: group or self-directed parent training programme for parents of children with more severe behavioural/developmental difficulties (involves 8-10 sessions of intensive work with parents, offered as three separate delivery approaches).
- Level 5: enhanced programme, individually tailored. Aimed at whole families with persistent childhood behavioural problems and where other sources of parental family stress are present.
A number of studies have shown Triple P to be effective in improving children's behaviour and parent-child interaction and reducing parenting conflicts. Studies have also shown:
- Improvements in disruptive behaviour to be maintained for up to two years after intervention.
- The intervention to be effective within a range of settings (standard, self-directed, telephone-assisted, group and enhanced intervention) and with several different family types.
The UK
Two notable preventative spending projects have been initiated in England. Conclusive evidence is not yet available for either project.
Early Intervention City: Nottingham (Nottingham City Council, 2010; Curryer, 2010)
Nottingham has become the UK's first early intervention city in 2008 with 16 different early intervention projects currently undertaken. The aim of the scheme is, "to break the intergenerational nature of underachievement and deprivation in Nottingham by identifying at the earliest possible opportunity those children, young people, adults and families who are likely to experience difficulty and to intervene and empower people to transform their lives and their future children's lives' (Nottingham City Council, 2010).
Through the plan drawn up in the council's local area agreement, Nottingham aims to:
- Reduce the number of children whose parents or siblings have offended, from offending.
- Decrease the number of repeat incidents of domestic violence.
- Reduce obesity/increase participation in activities and sport.
- Improve mental health.
- Provide the best start in life to children born to teenage parents.
- Accelerate the improvement in attainment of children in care and increase social aspiration.
- Accelerate the reduction of persistent absence across all City secondary schools.
Partnership and whole city ownership is a key principle underpinning the operation of the programme. It is supported by One Nottingham, the Local Strategic Partnership and its partners, and is championed by the City Council. The funding for the programme was allocated through a committee process whereby organisations together with a full business case bid for resources. At the end of the period, those projects with which there was no evidence of success were decommissioned. The University of Nottingham has also been incorporated in the project: Added value has been created by linking the programme with research undertaken by PhD students and the university has been involved in evaluating the success of the programmes.
During an evidence session with the SFC Ian Curryer outlined some of the findings to date:
- An immeasurable impact on childrens' access to language and readiness to enter more formal education later in life.
- Savings in the cost of domestic violence: it costs £5500 to relocate a family but with early intervention costs £3000 for improved security measures.
- Total cost of targeted early years package is £1400 per child against total cost of reading recovery teacher is 1660 per child – net saving £230.
- Stronger families violence project – saves £650 per year.
- Information sharing between departments has been a problem.
Total Place: Birmingham (Birmingham Total Place Pilot, 2010)
Total place is a new Whitehall strategy designed to look at a whole area and preventative spending approach to delivering public services. The aim of the scheme is to transform the system from a delivery led to service-led thinking and delivery based on outcomes. Still in its infancy, the programme is currently being piloted across 13 areas of England including Manchester and Birmingham. The following principles have been identified as key components of Total Place in Birmingham:
- A Budget for Birmingham
- Collective responsibility
- Applying evidence on cost-effectiveness
- Building services around people not agencies
- Supporting people and communities to do more for themselves
- Delivering major cross-sector efficiencies
- Freeing localities to deliver
9 pilot evidence based projects are current being implemented in Birmingham under the Brighter Futures banner which targets early years and young people. Investment of £42m over 15 years is estimated to yield a benefit of £101m to the council and £400m to the city. According to US research, through the focus on prevention Birmingham could save £400m over 15 years (Smith, Mark, 2009).
Total Place programmes are supported by enabling activities that focus on developing the workforce and improving working practices. Birmingham aim to transform the wider system in which children's services operate and to move from a service-led thinking to planning and delivery based on outcomes. The approach also utilises a sophisticated cost/benefit model that outlines cashable and non-cashable benefits generated.
One scheme amongst the many adopted aims to tackle the high prevalence of conduct disorder in Birmingham (which has a rate approaching 20% compared to the national average of 11%). Evidence suggests that at the age of 28 the cost of those who developed conduct disorders in childhood is estimated to be 10 times higher than those with no behavioural problems.
The success of correcting a conduct disorder at an early stage has been estimated at 75%, compared to a much lower success rate of 25% for adolescents. Based on this evidence, Birmingham have calculated that the cost of implementing the programme will generate cost savings of 2:1 (£2 Saved for every £1 spend) for council children's services, with a potential 4:1 saving across all agencies over 15 years.
Annex 3: Health Care
There are many obvious examples of successful preventative spending campaigns which are already incorporated into the healthcare system. This includes for example hand washing and immunizations. Nevertheless, studies demonstrate that there are still many more potential cost-effective preventative spending opportunities.
Case Study: Assessing Cost-Effectiveness in Prevention Study: Australia (Vos et. al, 2010)
The University of Queensland and Deakin University in Australia recently published on a report cited as being the largest and most rigorous evaluation of preventative strategies undertaken. The study assessed the cost-effectiveness of 150 different measures of preventative healthcare spending. The table below summarises the results:
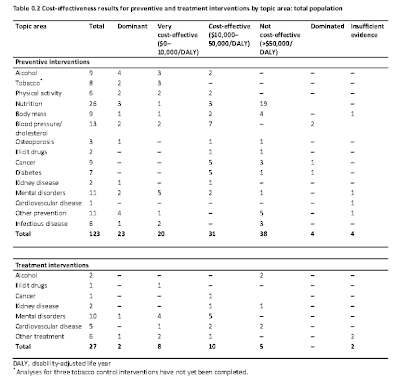
N.B. One DALY was estimated to equal $50,000 (Aus)
Results of study were classified into 5 categories:
- Dominant: interventions that both improve health and achieve net cost savings;
- Very cost-effective: interventions that improve health at a cost of less than $10,000 per DALY prevented;
- Cost-effective: interventions that improve health at a cost of between $10,000 and $50,000 per DALY prevented;
- Not cost-effective: interventions that improve health at a cost of more than $50,000 per DALY prevented; and
- Dominated: interventions for which more cost-effective alternatives are available.
The report made a number of cost-effective policy recommendations based on their conclusions, including:
- Actions:
- a 30% increase in tax on tobacco;
- a tax increase on alcohol;
- a taxation of 10% on non-core unhealthy foods [Interestingly an approach which has recently been implemented in Denmark (BBC Panorama, 2010)];
- mandatory limits on salt in bread, margarine and cereals;
- a shift to screening for absolute cardiovascular risk and targeted treatments
- pursuit of the introduction of a low-cost generic polypill (not containing aspirin) for cardiovascular prevention; and
- expansion of access to lap band surgery for the severely obese.
- Reallocation of funding towards best-practice prevention activities with strong cost-effectiveness credentials and away from prevention activities with poor cost-effectiveness credentials, including:
- inefficient cardiovascular preventive treatment;
- prostate-specific antigen (PSA) testing for prostate cancer;
- aspirin for primary prevention of cardiovascular disease;
- most approaches promoting fruit and vegetable intake and weight loss programs; and
- school-based illicit drug interventions.
- Expanded funding of a larger package of health promotion including:
- screening for pre-diabetes, chronic kidney disease, low bone mineral density in elderly women;
- subsidising nicotine replacement therapies; and
- a range of interventions promoting physical activity (pedometers, mass media, GP prescription or referrals).
- To introduce a number of cost-effective preventive interventions for mental disorders (screening for minor depression in adults, childhood depression and anxiety; problem-solving after a suicide attempt; and early psychosis intervention) accompanied by rigorous evaluation to expand the evidence base that is still thin and short-term; and
- To invest in evaluation research to contribute to the evidence base of prevention, particularly for policy initiatives and community-based interventions that have the potential to have large health impacts but that we had to model based on suggestive rather than solid evidence.
Case Study: Finland (Burnside, 2010)
In the 1960s, Finland had high rates of coronary heart disease and amongst the lowest life expectancy in the OECD. The North Karelia Project, launched in 1972, was a preventative intervention designed to reduce the risk factors in the population of North Karelia and was formulated and implemented to carry out a comprehensive intervention via local community organisations and individual action.
GPs, schools, libraries, local media and supermarkets were all involved in the scheme whose core message related to changing lifestyle choices, such as not smoking, doing more exercise, eating more fruit and vegetables, etc. Families affected by premature death and heart disease were convinced that by changing lifestyles, their health and wellbeing could be improved.
The implementation of the project resulted in significant savings in health expenditure, and coronary heart disease mortality rates in the North Karelia male population reduced by 82% in 2002 compared with the pre-programme years. In the 1980s the scheme was replicated throughout Finland which resulted in coronary heart disease mortality among men falling by approximately 75%.
Annex 4: Drugs and Alcohol
Case Study: The Matter Hospital, Belfast (RCN, 2010)
Practice in the Matter hospital was identified by the Royal College of Nursing in Scotland as being a good example of effective preventative spending. The Matter employed one alcohol liaison nurse to take referrals from all clinical departments in the hospital, carrying out screening, assessment and treatment, as well as making referrals to GPs and the community addiction team. It was calculated that the preventative work carried out by the nurse saved an estimated £237,115 through reduced bed days in one year.
Case Study: Birmingham Total Place (HubCAPP, 2009; HM Treasury, 2010)
Birmingham identified drug and alcohol misuse as a key area of interest and, as such, the Repeat Attendees at A&E and Acute Units multi-agency project has been undertaken as part of an attempt to make effective savings on the demand for government services.
It was identified that in the city alcohol-specific admissions were mostly occasioned by complex medical conditions requiring in-patient treatment. Also, alcohol-dependency and misuse is associated with a range of social harms. As such, hazardous and harmful drinkers were more likely to become unemployed and experience homelessness or other forms of social exclusion and economic disadvantage as a direct, or indirect, result of their alcohol consumption. Furthermore, it was indentified that there was a perceived gap in service delivery, and that opportunities to conduct integrated assessment, care-planning and information sharing, needed further development.
The project is acting as a 'Test and Learn' model designed to explore opportunities to integrate protocols, and find ways to optimise treatment and support in a multi-disciplinary context. As yet there is no data on specific outcomes; however a key milestone in assessing the impact made by the Total Place trials will come early in December 2010 with the publication of the Comprehensive Area Assessment.
Annex 5: Policing and Justice
Case Study: Justice Reinvestment Programme, Texas (NESTA, 2010)
Between 1985-2005, the prison population in Texas grew 300% costing the state over $2bn in constructing new beds. In 2007 when forecasts predicted prison numbers to grow by another 14,000, Texas rejected plans to spend $0.5bn on a new prison in favour of Justice reinvestment; a programme designed to tackle the root causes of crime. This redirected money from prisons towards addressing the re-settlement needs of prisoners whilst also improving the conditions of the most affected communities in hope of preventing initial reoffending.
Following this approach, Texas redirected half of the money ear-marked for the new prison on expanding residential and out-patient treatment centres for mental health, substance misuse and post-prison support. The cost of treatment was significantly less than the cost of the prison and impacts were felt in the short-term. Justice Reinvestment reduced parole revocations by 25% and the prison population increase was 90% less than predicted. Texas estimated savings of $210.5 million in 2008/9 and additional savings from averted prison construction of $233 million.
Case Study: Restorative Justice, UK (NESTA, 2010; Moran, 2009)
In a number of communities across the UK 'Restorative Justice' (RJ) is being used to tackle recidivism. In a controlled, safe environment the offender meets the victim of their crime and is encouraged to assume responsibility for their actions. For the victims of crime 41% say they want to meet the offender and 51% think restorative justice would work better than prison to reduce re-offending.
The findings:
- RJ has reduced re-offending by an average of 27%, by up to 33% when delivered in prison and by 55% when delivered in the community.
- 75-95% of victims who take part in RJ are glad they did so.
- RJ has been shown to reduce post traumatic stress symptoms of victims and help them return to work following serious crimes.
- Recent Pilots saved the criminal justice system over £7million: for every £1 spent on delivering RJ conferences, £9 was saved from the costs of re-offending.
Case Study: Justice Policies, Scotland (Burnside, 2010)
Burnside outlined the following schemes which are aimed at preventing crime:
- CashBack for Communities is a programme of diversionary activities for young people to increase the opportunities they have to develop their interests and skills in an enjoyable, fulfilling and supported way, using funds recovered from criminals.
- The Violence Reduction Unit (VRU) was established in 2005 by Strathclyde Police and the Unit's remit was extended in 2006 by the then Scottish Executive to create a national centre of expertise on tackling violent crime. The Scottish Government currently sponsors the VRU through its Drugs and Community Safety budget.
- The Community Initiative to Reduce Violence (CIRV) was launched in the east end of Glasgow in 2008 and seeks to intensively engage with over 700 identified gang members and provide them with a range of support services and diversion projects in an effort to change their behaviour and lives. The Violence Reduction Unit is leading this project and the Scottish Government has already committed £1.6 million to the project with a further £3.4 million funding provided in services and in kind by partners.
- The No Knives, Better Lives campaign is a Scottish Government-led initiative which challenges attitudes to knife carrying amongst young people in Scotland. The Government has committed £500,000 to the campaign which was launched in Inverclyde in 2009. Recent press reports suggest that knife carrying in the area has fallen by 23% following the introduction of the initiative.
- The Violence Reduction Unit also supports Medics Against Violence, a charity set up by three Scottish surgeons which encourages medical professionals to be involved in violence prevention work. It currently operates a schools programme which sees volunteer health care professionals deliver anti-violence lessons in schools. Lessons are targeted at S2 pupils, and are designed to engage with pupils before they get involved in serious knife crime, but use some graphic images not suitable for younger pupils.
- Knife Licensing Scheme. From 1 June 2010, all dealers in knives are required to hold a knife dealers licence under the Civic Government (Scotland) Act 1982. The intention behind the scheme is that it will make it harder for knives to fall into the wrong hands.
Annex 6: Social Services and Domestic Violence
Case Study: Sanctuary Project, Nottingham (Curryer, 2010; Shippam, 2009)
Nottinghamshire police reported that 25% of violent crime in Nottingham was domestic violence. The Sanctuary project was established as a person centred initiative, designed to enable survivors of domestic abuse to remain in their homes and feel safe. The initiative was designed as an early intervention measure to prevent further violence, homelessness to ensure security and stability for the entire household. Once the perpetrator had been evicted, The project would enable those survivors who wanted to stay at home and organise extra security and support, which would managed by a Sanctuary Co-ordinator. This would be a higher level of support than is currently offered by the Home Watch Security Scheme as it would include improved physical safety and structured specialist domestic violence Floating Support.
The Findings:
- 100% service users reported as being either satisfied or very satisfied with Sanctuary service.
- No survivors have moved house due to domestic violence after installation.
- The costs of relocating a family was estimated at £5,500 while the costs of added security measures were calculated at £3000: savings were therefore estimated to be around £2500 per intervention.
- The scheme meets the needs of most families who do not want to move.
Sanctuary Cost/Benefit Analysis
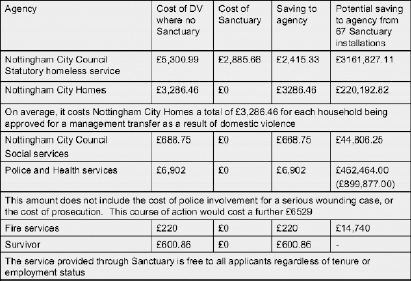
Annex 7: The Elderly and Disabled
Case Study: Older Peoples Advice Project (Falkirk Council, 2010; Scottish Federation of Housing Associations , 2010)
The Older Persons' Advice Project aims to increase the levels of benefit take up amongst older people (age 60+) resident in the Falkirk Community Planning Partnership areas. The aims and the objectives of the Project are to:
- Increase the rate of uptake of benefits by over 60s resident in the Priority Areas through the provision of support at all stages of making a claim.
- Effectively 'drain the pool' of existing under claimants within the population, reaching over 60s who have previously not been in contact with advice or income maximisation services.
- Link over 60s with the full range of services within their community.
- 'Stop the flow' of older people into the pool of under claimants in the future.
- Address fuel poverty amongst older households through income maximisation.
The project is based around an intensive proactive effort to reach out to all over 60s in the priority areas, many of whom would otherwise be unlikely or reluctant to engage with income maximisation and advice services.
A recently completed Social Return on Investment study of the OPAP project revealed that for every pound invested in the project, it generated a social return on investment of £27.53; i.e. savings to the public purse across a range of different budgets including health, social care and welfare benefits. Some of the project's main impacts include:
- Increased household income for OPAP clients by an average of £1,150 a year per annum.
- Improved quality of life for clients, such as reduced social isolation and improved diet.
- Improvement in clients' long-term health conditions.
- Reduced fuel poverty among clients.
- Reduced demand on NHS services from clients.
- Increased income to the Scottish economy due to clients' increased income and their resulting spending.
Case Study: Partnerships for older people projects (Age Scotland, 2010)
The Partnership for Older People Projects (POPP) were funded by the Department of Health in order to develop services for older people, aimed at promoting their health, well-being and independence and preventing or delaying their need for higher intensity or institutional care. Twenty-nine local authorities were involved as pilot sites, working with health and voluntary sector partners to develop services, with funding of £60m. Two-thirds of the services in the POPPs areas were primarily directed at reducing social isolation and exclusion or promoting healthy living among older people. The rest focused on avoiding hospital admission or facilitating early discharge from acute or institutional care.
Amongst the results were:
- Overnight hospital stays were reduced by 47% and use of Accident and Emergency departments by 29%. This reduction resulted in considerable savings, to the extent that for every extra £1 spent on the POPP services, there has been approximately a £1.20 additional benefit in savings on emergency bed days.
- Reductions were also seen in physiotherapy/occupational therapy and clinic or outpatient appointments with a total cost reduction of £2,166 per person.
- Visits to A&E departments fell by 60%, hospital overnight stays were reduced by 48%, phone calls to GPs fell by 28%, visits to practice nurses reduced by 25% and GP appointments reduced by 10%.
- The evaluation found that a wide range of projects resulted in improved quality of life for participants and considerable savings, as well as better local working relationships.
Annex 8: The Application of Preventative Spending
Case Study: Social Impact Bonds, Peterborough (Age Scotland, 2010)
This bond pilot is designed to fund third sector organisations working to reduce re-offending rates of short sentence male prisoners leaving Peterborough Prison. Using the bond, the Ministry of Justice has agreed to make payments to investors in the event that re-offending is reduced below an agreed threshold.
The bond, which is funded by trusts and foundations, commercial investors and high net worth individuals, has raised £5m and will pay out a return depending on the reduction in re-offending rates amongst 3,000 young men on the scheme.
If this initiative reduces re-offending by 7.5% or more, investors will receive from Government a share of the long-term savings. If the bond delivers a drop in re-offending beyond the threshold, investors will receive an increasing return the greater the success at achieving the social outcome, up to a maximum of 13%. If the re-offending rate does not fall by at least 7.5% then investor will receive no return.
Case Study: Early Intervention City, Nottingham (Curryer, 2010)
Nottingham City Council required that organisations put together a full business case and bid for funding from a pooled budget for Early Intervention projects. Curryer details how this has shown benefits as the council has been decommissioning projects which did not demonstrated sufficient impact. 'In doing that, we are going back to the business case and using the evidence, evaluation, outputs and outcomes that were detailed in it to decommission work that has not shown success' (Curryer, 2010).
The council identified a range of characteristics of the projects which are working well:
- Intensive and focused on behaviour change.
- Evidence-based and delivered with strict fidelity. This tends to be supported by an effective supervision model with a clear trajectory of early indicators to monitor, for example, the Family-Nurse Partnership.
- Targeted at specific groups, at critical times.
- Where there is consideration of the whole context and causes, rather than symptoms.
- Caseloads that allow time to build a good relationship between the worker and family / child those when a strengths-based approach is used. This links to decreased direct demand on social care, or a more effective relationship.
- Where there is strong leadership and management by the project lead.
- Where deliverers are clear on specific early signs of risky behaviour, engage the child / family in an assessment and have access to a clear referral process. For example, referrals into drug treatment have increased by 327% from DrugAware schools. Referrals have also been at an earlier stage, treatment time has been shortened and success rates have been higher.
- Where there are good communications in place so that a service is visible.
Characteristics of the projects which are not working well:
- Evaluation is poor and does not reflect the positive impact reported by workers.
- The intervention is not for a consistent reason, for example mentoring, and is therefore difficult to evaluate.
- When a project is implemented on top of an unstable system or where there has been turbulence and high vacancy levels in the delivery team.
- Where referral numbers have not been high enough. This suggests that the service is either not visible or not needed.
Case Study: Surestart Evaluation (Burnside, 2010)
'Sure Start Local Programmes (SSLPs) were set up as community based, multi-agency projects in some of the most disadvantaged areas in England. The aim of the intervention was to improve the well-being, attainments and life chances of all children aged 0-4 years old in the area and to support their families. An evaluation (Anning et al 2007) of the Surestart scheme in England found that there were varying degrees of effectiveness of schemes and it was not just about having an early intervention project, but about having the right project. The key findings of the evaluation were as follows:
- Proficient and effective SSLPs took a holistic approach to implementing the Sure Start vision.
- They built on the strengths of inherited provision and were creative in improving and setting up services.
- What worked at strategic level was: systemic, sustainable structures in governance and management/leadership;
- a welcoming, informal but professional ethos;
- empowering parents, children and practitioners.
What worked at operational level was:
- auditing and responding to community priorities in universal services;
- early identification and targeting of children and parents to benefit from specialist services;
- recruiting, training and deploying providers with appropriate qualifications and personal attributes; and
- managing the complexities of multi-agency teamwork.
However, overall "reach" figures were disappointing. Those who used services often used several, and reported satisfaction with them. But services offered at traditional times and in conventional formats did not reach many fathers, black and minority ethnic families and working parents. Providers found barriers to attracting "hard to reach" families difficult to overcome.
Few programmes demonstrated proficiency in (1) systematically monitoring, analysing and responding to patterns of service use or (2) rigour in measuring the impact of treatments.
Multi-agency teamwork, including effective ways of sharing information, and clarity about the cost-effectiveness of deploying specialist and generalist workers strategically, proved difficult to manage and operate.'
Case Study: Total Place, Birmingham (2010)
Birmingham City Council identified the following objectives for Total Place:
- Developing a 'Budget for Birmingham'
- Collective responsibility for Birmingham.
- Applying evidence on cost-effectiveness.
- Building services around people not agencies.
- Supporting people and communities to do more for themselves.
- Delivering major cross-sector efficiencies.
- Freeing localities to deliver.
Following the implementation of Total Place Birmingham also identified a number of obstacles and recommendations:
- Because many preventative measures take a number of years to generate overall savings, there was a need to move public investment from a short (one year) timeframe to a longer period.
- Conflicting performance management and regulatory expectations on different partners/sectors needed to be removed. Their existence forced partners to focus energies in different directions.
- Accountable officer responsibilities needed to be delegated to local areas in spending in local areas to ensure that ministers were not held accountable.
- National rules often got in the way of sensible outcomes: more local flexibility was necessary.
- The burden of national reporting needed to be reduced.
- More systematic evaluation of 'what works' and the conditions necessary to make it work were needed coupled with reliable cost benefit analysis.
- As data protection legislation was interpreted differently by different organisations, the public sector could not pool their knowledge and connect their actions.
Bibliography
Aberlour Childcare Trust. (2010). Scottish Finance Committee inquiry into Preventative Spending: Submissions Received. Retrieved November 23, 2010, from The Scottish Parliament: http://www.scottish.parliament.uk/s3/committees/finance/inquiries/preventative/PS-AberlourChildcare.pdf
Action for Children. (2009, September). Scottish Finance Committee inquiry into Preventative Spending: Submissions Received. Retrieved November 9, 2010, from The Scottish Parliament: http://www.scottish.parliament.uk/s3/committees/finance/inquiries/preventative/PS-ActionforChildren.pdf
Addaction. (2008, February). Financial Cost of Addiction Briefing. Retrieved November 30, 2010, from Addaction.org.uk: http://www.addaction.org.uk/core/core_picker/download.asp?id=53&filetitle=The+financial+cost+of+addiction
Age Scotland. (2010). SFC Submissions. Retrieved December 1, 2010, from The Scottish Parliament: http://www.scottish.parliament.uk/s3/committees/finance/inquiries/preventative/PSAgeScotland.pdf
Alzheimer's Australia. (2010). Retrieved December 1, 2010, from Mind Your Mind: http://mindyourmind.org.au/
Arbuthnott, S. J. (2010, September 21). Finance Committee Official Report 21 September 2010. Retrieved October 21, 2010, from The Scottish Parliament: http://www.scottish.parliament.uk/s3/committees/finance/or-10/fi10-2002.htm#Col2475
ASH. (2010). Finance Committee inquiry into preventative spending: Submissions Received. Retrieved November 25, 2010, from The Scottish Parliament: http://www.scottish.parliament.uk/s3/committees/finance/inquiries/preventative/PS-ASHScotland.pdf
Association of Directors of Social Work. (2010). SFC Submissions. Retrieved December 1, 2010, from The Scottish Parliament: http://www.scottish.parliament.uk/s3/committees/finance/inquiries/preventative/PS-ADSW.pdf
Barnados. (2008, January). Northern Ireland Executive Draft Budget 2008-11: Barnados Response. Retrieved November 29, 2010, from Barnados: http://www.barnardos.org.uk/draft_budget_2008-2011.pdf
Barnados Scotland. (2010). SFC Inquiry Submission. Retrieved December 6, 2010, from The Scottish Parliament: http://www.scottish.parliament.uk/s3/committees/finance/inquiries/preventative/PS-BarnardosScotland.pdf
BBC News. (2010, February 3). Action needed on benefits take-up . Retrieved December 7, 2010, from BBC News: http://news.bbc.co.uk/1/hi/business/8494105.stm
BBC News. (2009, April 21). Breastfeeding 'protects mother' . Retrieved December 7, 2010, from BBC News: http://news.bbc.co.uk/1/hi/health/8008678.stm
BBC News. (2010, October 20). Euro MPs back 20-week maternity leave plan. Retrieved December 7, 2010, from BBC News: http://www.bbc.co.uk/news/world-europe-11582112
BBC News. (2006). In detail: Prisons in the UK. Retrieved November 30, 2010, from BBC News: http://news.bbc.co.uk/1/shared/spl/hi/pop_ups/06/uk_prisons_in_the_uk/html/6.stm
BBC News. (2010, November 4). Most offenders return to crime, official figures show. Retrieved November 29, 2010, from BBC News: http://www.bbc.co.uk/news/uk-11692852
BBC News. (2010, January 1). Rising alcohol addiction costs 'could cripple the NHS' . Retrieved November 30, 2010, from BBC News: http://news.bbc.co.uk/1/hi/8433935.stm
BBC News. (2004, October 6). Sharp increase in diabetes cases. Retrieved November 30, 2010, from BBC News: http://news.bbc.co.uk/1/hi/health/3719490.stm
BBC News. (2010, December 2). UK offers families raw deal, says Fatherhood Institute. Retrieved December 2, 2010, from BBC News: http://www.bbc.co.uk/news/uk-11895946
BBC Panorama. (2010, November 15). Should the UK tax high-fat junk food to cut obesity rates? . Retrieved November 30, 2010, from BBC Panorama: http://news.bbc.co.uk/panorama/hi/front_page/newsid_9176000/9176897.stm
Belfast Telegraph. (2010, December 1). Abuse 'reported every 21 minutes'. Retrieved December 7, 2010, from Belfast Telegraph: http://www.belfasttelegraph.co.uk/news/local-national/northern-ireland/domestic-abuse-reported-every-21-minutes-15018288.html
Belfast Telegraph. (2010, November 17). £7m cost of treating addiction. Retrieved January 13, 2011, from Belfast Telegraph: http://www.belfasttelegraph.co.uk/news/local-national/northern-ireland/7m-cost-of-treating-addiction-15006687.html
Belfast Telegraph. (2010, November 3). Crime 'costs economy £2.9bn a year'. Retrieved January 13, 2011, from Belfast Telegraph: http://www.belfasttelegraph.co.uk/news/local-national/northern-ireland/crime-costs-economy-29bn-a-year-14994533.html
Birmingham Total Place Pilot. (2010, February). Total Place. Retrieved November 30, 2010, from Be Birmingham: http://www.bebirmingham.org.uk/documents/TP_Birmingham_Final_Report_version_2.pdf
Burnside, R. (2010, September 9th). Preventative Spending - Literature Review. Retrieved November 9th, 2010, from Scottish Parliament:: http://www.scottish.parliament.uk/business/research/briefings-10/SB10-57.pdf
Carnochan, D. C. (2010, October 26). Finance Committee Official Report . Retrieved November 30, 2010, from The Scottish Government: http://www.scottish.parliament.uk/s3/committees/finance/or-10/fi10-2202.htm
CFP. (2010, February 10). Committee for Finance and Personnel: Report on the Inquiry into Public Procurement in Northern Ireland. Retrieved December 8, 2010, from The Northern Ireland Assembly: http://archive.niassembly.gov.uk/finance/2007mandate/reports/Report_19_08_09R.htm
Children in Scotland. (2010). Finance Committee Submission From Children in Scotland. Retrieved November 29, 2010, from The Scottish
Parliament: http://www.scottish.parliament.uk/s3/committees/finance/inquiries/preventative/PS-ChildreninScotland.pdf
Children in Scotland. (2010). Scottish Finance Committee inquiry into Preventative Spending: Submissions Received. Retrieved November 29, 2010, from The Scottish Parliament: http://www.scottish.parliament.uk/s3/committees/finance/inquiries/preventative/PS-ChildreninScotland.pdf
Connor, S. (2009, February 24). NHS resources threatened as diabetes cases soar 70 per cent. Retrieved November 9, 2010, from Independent.co.uk: http://www.independent.co.uk/life-style/health-and-families/health-news/nhs-resources-threatened-as-diabetes-cases-soar-70-per-cent-1630309.html
Curryer, I. (2010, November 16). Finance Committee Official Report 16 November 2010 . Retrieved November 25, 2010, from The Scottish Parliament: http://www.scottish.parliament.uk/s3/committees/finance/or-10/fi10-2502.htm
Deacon, S. (2010, November 9). Finance Committee Official Report. Retrieved December 6, 2010, from The Scottish Parliament: http://www.scottish.parliament.uk/s3/committees/finance/or-10/fi10-2402.htm
Department for Children, Schools and Families. (2010, March). Publications. Retrieved November 16, 2010, from Department for Education: http://publications.education.gov.uk/default.aspx?PageFunction=productdetails&PageMode=publications&ProductId=DCSF-00349-2010&
Devaney, D. J. (2009, 12 10). School of Sociology, Social Policy & Social Work. Retrieved December 7, 2010, from Queens University: http://www.qub.ac.uk/schools/SchoolofSociologySocialPolicySocialWork/Archives/News0910/
Diabetes UK. (2005, March). Obesity and diabetes: a heavy burden. Retrieved November 30, 2010, from Diabetes UK:
http://www.diabetes.org.uk/Professionals/Publications-reports-and-resources/Reports-statistics-and-case-studies/Reports/Obesity_increases_diabetes_risk_by_80_times/
Diabetes.co.uk. (2010, October 27). Diabetes costs the NHS one million pounds an hour. Retrieved November 30, 2010, from Diabetes.co.uk: http://www.diabetes.co.uk/news/2010/Oct/diabetes-costs-the-nhs-one-million-pounds-an-hour-93645072.html
Falkirk Council. (2010). Linkwide Older People's Advice Project . Retrieved December 1, 2010, from Falkirk Council: http://www.falkirk.gov.uk/services/corporate_neighbourhood/policy_performance_review/corporate_policy/community_regeneration/fairer
_scotland_fund/project_profiles/older_peoples_advice_project.aspx
Friends of the Earth. (2010). SFC Submissions. Retrieved November 30, 2010, from The Scottish Parliament: http://www.scottish.parliament.uk/s3/committees/finance/inquiries/preventative/PS-Friends_of_the_Earth.pdf
Geddes, D. R. (2010, November 2). Finance Committee Official Report . Retrieved December 5, 2010, from The Scottish Parliament: http://www.scottish.parliament.uk/s3/committees/finance/or-10/fi10-2302.htm
HighScope. (2010). HighScope Perry Preschool Study. Retrieved November 25, 2010, from www.highscope.org: http://www.highscope.org/content.asp?contentid=219
Hill, C., & Reiss, N. (2008, July 3). Prevention of Dementia and Other Cognitive Disorders. Retrieved December 1, 2010, from Mental Help: http://www.mentalhelp.net/poc/view_doc.php?type=doc&id=15339&cn=231
HM Treasury. (2010, March). Total place: A whole area approach to public services. Retrieved November 30, 2010, from HM Treasury: http://www.hm-treasury.gov.uk/d/total_place_report.pdf
Hosking, G. (2010, November 9). Finance Committee Official Report. Retrieved November 29, 2010, from The Scottish Parliament: http://www.scottish.parliament.uk/s3/committees/finance/or-10/fi10-2402.htm
Hosking, G., & Ita, W. (2010). Trust International Early Intervention Review. Retrieved November 25, 2010, from http://www.wavetrust.org/: http://www.wavetrust.org/WAVE_Reports/WAVE_Trust_International_Early_Intervention_Review_2010.pdf
Houston, A. (2010, November 2). Finance Committee Official Report. Retrieved December 6, 2010, from The Scottish Parliament: http://www.scottish.parliament.uk/s3/committees/finance/or-10/fi10-2302.htm
HubCAPP. (2009). Birmingham | Total Place Pilot – Repeat Attendees at A&E and Acute Units. Retrieved November 30, 2010, from HubCAPP: http://www.hubcapp.org.uk/Q85Z
Hutchings, J. (2007, September 1). The Increadible Years. Retrieved November 29, 2010, from http://www.incredibleyears.com/library/paper.asp?nMode=1&nLibraryID=475
Independent Living in Scotland Project. (2010, October 5). SFC Submission. Retrieved December 5, 2010, from The Scottish Parliament: http://www.scottish.parliament.uk/s3/committees/finance/papers-10/fip10-21.pdf
Institute of Public Health. (2010, March 15). IPH predicts dramatic rise in chronic diseases - hypertension, coronary heart disease, stroke and diabetes (NI data). Retrieved November 9, 2010, from Institue of Public Health: http://www.publichealth.ie/news/nipressreleasenumberwithachronichealthproblemtoincreaseby30by2020
Kearney, V. (2009, October 22). Lawyers face legal aid fees cut . Retrieved November 29, 2010, from BBC News: http://news.bbc.co.uk/1/hi/northern_ireland/8319449.stm
Kelly, M. (2010, February 10). Committee for Employment & Learning: Official Report. Retrieved November 29, 2010, from The Northern Ireland Assembly: http://archive.niassembly.gov.uk/record/committees2009/EmploymentLearning/100210_NEETs_Barnardos.htm
Marsh, K. (2008, July 28). The real cost of prison. Moral, social and political arguments for and against prison are all very well. But what about value for money? Retrieved November 29, 2010, from The Guardian:
http://www.guardian.co.uk/commentisfree/2008/jul/28/justice.prisonsandprobation
Maryon-Davis, D. A. (2009, July 1). NHS faces 'folly' of short-sighted cuts. Retrieved November 9, 2010, from BBC News: http://news.bbc.co.uk/1/hi/health/8114696.stm
McBride, P. (2010, November 19). Letter from Niamh Mental Wellbeing to the Chair of the Committee for Finance & Personnel.
McDougall, C., Cohen, M., Swaray, R., & Perry, A. (2010). Could economics solve the prison crisis? Probation Journal (57), 263-280.
Melhuish, P. E. (2010, September 21). Finance Committee Official Report . Retrieved December 6, 2010, from The Scottish Parliament:
http://www.scottish.parliament.uk/s3/committees/finance/or-10/fi10-2002.htm#Col2475
Melhuish, P. E. (2010). Scottish Finance Committee inquiry into Preventative Spending: Submissions Received. Retrieved November 30,
2010, from The Scottish Parliament: http://www.scottish.parliament.uk/s3/committees/finance/papers-10/fip10-20.pdf
Melhuish, P. E. (2010). Scottish Finance Committee inquiry into Preventative Spending: Submissions Received. Retrieved November 23,
2010, from www.scottish.parliament.uk:
http://www.scottish.parliament.uk/s3/committees/finance/inquiries/preventative/Edward_Melhuish.pdf
Melhuish, P. E. (2010). Scottish Finance Committee: Prevenative Spending Inquiry. Retrieved November 30, 2010, from The Scottish Parliament: http://www.scottish.parliament.uk/s3/committees/finance/papers-10/fip10-20.pdf
Mills, T. (2006, February 27). Anger at mental health 'scandal'. Retrieved November 30, 2010, from BBC News: http://news.bbc.co.uk/1/hi/northern_ireland/4756796.stm
Moran, P. (2009, January 13). Early Intervention Seminars. Retrieved December 1, 2010, from Nottingham City Council: http://www.nottinghamcity.gov.uk/CHttpHandler.ashx?id=8916&p=0
NES Psycology. (2010). PSI submissions. Retrieved November 29, 2010, from The Scottish Parliament: http://www.scottish.parliament.uk/s3/committees/finance/inquiries/preventative/PS-NESPsychology.pdf
NESTA. (2010). Scottish Finance Committee inquiry into Preventative Spending: Submissions Received. Retrieved November 30, 2010, from The Scottish Parliament: http://www.scottish.parliament.uk/s3/committees/finance/inquiries/preventative/NESTAsupp.pdf
NHS. (2010). Mental Health. Retrieved December 7, 2010, from NHS.uk: http://www.nhs.uk/conditions/Mental-health/Pages/Introduction.aspx?url=Pages%2FWhat-is-it.aspx
NHS Wales. (2004). Deprivation and Health. Retrieved January 13, 2011, from NHS Wales: http://www.wales.nhs.uk/sites3/documents/368/Deprivationreport10dec04.pdf
NI Assembly. (2009, April). Cost Per Prisoner Place. Retrieved December 1, 2010, from NI Assembly: http://archive.niassembly.gov.uk/researchandlibrary/2010/15310.pdf
Niven, R. (2010, February 25). Report reveals £31bn cost of Neets. Retrieved November 29, 2010, from Newstart: http://www.newstartmag.co.uk/news/article/report-reveals-31bn-cost-of-neets
Nottingham City Council. (2010). Early Intervention City Programme Briefing. Retrieved November 25, 2010, from My Nottingham: http://www.nottinghamcity.gov.uk/index.aspx?articleid=520
Nottingham City Council. (2010). Scottish Finance Committee inquiry into Preventative Spending: Submissions Received. Retrieved November 29, 2010, from The Scottish Parliament: http://www.scottish.parliament.uk/s3/committees/finance/papers-10/fip10-25.pdf
OECD. (2010, March 10). OECD report - Economic Policy Reforms: Going for Growth 2010. Retrieved November 23, 2010, from
www.oecd.org: http://www.oecd.org/dataoecd/2/7/45002641.pdf
Oxfam. (2010). Finance Committee Inquiry into Prevenative Spending Submission. Retrieved November 29, 2010, from The Scottish
Parliament: http://www.scottish.parliament.uk/s3/committees/finance/inquiries/preventative/PS-Oxfam.pdf
Oxfam. (2010). Preventative Spending Inquiry: Tabled Papers. Retrieved November 30, 2010, from The Scottish Parliament: http://www.scottish.parliament.uk/s3/committees/finance/papers-10/fip10-23.pdf
Oxfam. (2010). Scottish Finance Committee inquiry into Preventative Spending: Submissions Received. Retrieved November 29, 2010, from The Scottish Parliament: http://www.scottish.parliament.uk/s3/committees/finance/inquiries/preventative/PS-Oxfam.pdf
Press Association. (2009, June 9). Smoking costs NHS £5bn a year. Retrieved November 9, 2010, from Independent.co.uk: http://www.independent.co.uk/life-style/health-and-families/health-news/smoking-costs-nhs-pound5bn-a-year-1700509.html
Prince's Trust. (2010, December). Cost of youth disadvantage in UK at new high. Retrieved December 7, 2010, from Prince's Trust: http://www.princes-trust.org.uk/about_the_trust/what_we_do/research/cost_of_exclusion_2010/press_release.aspx
Prison Service. (2010, November 22). Population Report. Retrieved November 29, 2010, from Prison Service: http://www.niprisonservice.gov.uk/module.cfm/opt/8/area/Population_Report/page/population/
PSNI. (2010, March). PSNI Annual Statistical Report . Retrieved December 7, 2010, from Police Service of Northern Ireland: http://www.psni.police.uk/2._domestic_incidents_and_crimes_final.pdf
RCN. (2010). SFC Submissions. Retrieved November 30, 2010, from The Scottish Parliament: http://www.scottish.parliament.uk/s3/committees/finance/inquiries/preventative/PS-RCNScotland.pdf
Reuters. (2010, April 8). More breastfeeding could save U.S. billions: study. Retrieved December 7, 2010, from The Food Doctor: http://www.thefooddoctor.com/Article-Ahealth_press_breastfeed/
Roberts, M. (2010, September 21). What's the true cost of dementia? Retrieved January 17, 2011, from BBC News: http://www.bbc.co.uk/news/health-11381229
Save the Children. (2010). Northern Ireland. Retrieved November 23, 2010, from www.savethechildren.org.uk: http://www.savethechildren.org.uk/en/northern-ireland.htm
Save the Children. (2010). Scottish Finance Committee inquiry into Preventative Spending: Submissions Received. Retrieved November 30, 2010, from The Scottish Parliament: http://www.scottish.parliament.uk/s3/committees/finance/papers-10/fip10-23.pdf
Scottish Federation of Housing Associations . (2010). SFC Submission. Retrieved December 1, 2010, from The Scottish Parliament: http://www.scottish.parliament.uk/s3/committees/finance/inquiries/preventative/PS-FederationHousingAssociations.pdf
Scottish Parliament. (2010, October 28). Spending now to save later. Retrieved November 9, 2010, from Holyrood Magazine:
http://preventativespending.holyrood.com/agenda
Serenity Café Projec. (2010). Scottish Finance Committee inquiry into Preventative Spending: Submissions Received. Retrieved November 30, 2010, from The Scottish Parliament: http://www.scottish.parliament.uk/s3/committees/finance/inquiries/preventative/PS-
SerenityCafeProject.pdf
Sher, D. J. (2010, November 2). Finance Committee Official Report. Retrieved November 29, 2010, from The Scottish Parliament:
http://www.scottish.parliament.uk/s3/committees/finance/or-10/fi10-2302.htm
Shippam, R. (2009, March 17). The Early Intervention Seminars. Retrieved December 1, 2010, from Nottingham City Council: http://www.nottinghamcity.gov.uk/CHttpHandler.ashx?id=8934&p=0
Sinclair, A. (2010, September 21). Finance Committee Official Report. Retrieved November 30, 2010, from The Scottish Parliament: http://www.scottish-parliament.tv/s3/committees/finance/or-10/fi10-2002.htm
Smith, Mark. (2009, November 4). Overlapping interests. Retrieved November 30, 2010, from The Guardian: http://www.guardianpublic.co.uk/total-place-audit-commission-roundtable
Sturcke, J. (2010, February 3). Britain ignoring its dementia crisis, Oxford study finds. Retrieved December 1, 2010, from The Guardian: http://www.guardian.co.uk/lifeandstyle/2010/feb/03/uk-dementia-crisis-feared-worse
The Guardian. (2010). UK GDP Since 1948. Retrieved January 13, 2011, from Dadablog: http://www.guardian.co.uk/news/datablog/2009/nov/25/gdp-uk-1948-growth-economy
Transform Scotland. (2010). SFC: Submissions. Retrieved November 30, 2010, from The Scottish Parliament: http://www.scottish.parliament.uk/s3/committees/finance/inquiries/preventative/PS-TransformScotland.pdf
UNICEF. (2007). UNICEF Publications. Retrieved November 23, 2010, from www.unicef-irc.org: http://www.unicef-irc.org/publications/pdf/rc7_eng.pdf
Violence Reducation Unit. (2010). Scottish Finance Committee: Preventative Spending Inquiry. Retrieved November 30, 2010, from The Scottish Parliament: http://www.scottish.parliament.uk/s3/committees/finance/inquiries/preventative/PS-ViolenceReduction.pdf
Vos, T., Carter, R., Barendregt, J., Mihalopoulos, C., & Veerman, L. (2010, September 10). Assessing Cost-Effectiveness in Prevention - Final Report. Retrieved November 25, 2010, from Australian Health Promotion Association:
http://www.healthpromotion.org.au/issues/291?task=view
Watson, S. (2010, November 2). Finance Committee Official Report. Retrieved December 5, 2010, from The Scottish Parliament: http://www.scottish.parliament.uk/s3/committees/finance/or-10/fi10-2302.htm
WAVE. (2010). Finance Committee: Inquiry Into Preventative Spending Submissions. Retrieved November 29, 2010, from The Scottish Parliament: http://www.scottish.parliament.uk/s3/committees/finance/papers-10/fip10-24.pdf
Wilford, R. (2009). Consociational Government: Inside the NI Executive. In R. Taylor, Consociational Theory (pp. 180-196). Abingdon: Routledge.
Wilson, P. (2010). Scottish Finance Committee inquiry into Preventative Spending: Submissions Received. Retrieved November 23, 2010, from www.scottish.parliament.uk: http://www.scottish.parliament.uk/s3/committees/finance/inquiries/preventative/PS-PhilipWilson.pdf
World Health Organisation. (2010, July 7). WHO Statistics about Diabetes - WHO European Region . Retrieved November 30, 2010, from IMG Care: http://img-care.com/index.php/diabetes/32-who-statistics-about-diabetes-?start=3
WVRS. (2010). SFC Submissions. Retrieved December 1, 2010, from The Scottish Parliament: http://www.scottish.parliament.uk/s3/committees/finance/inquiries/preventative/PS-WVRS.pdf
Yew, M. L. (2010, October 4). Cost of mental ill health soars to £105bn per year. Retrieved November 9, 2010, from Guardian.co.uk: http://www.guardian.co.uk/society/2010/oct/04/cost-mental-ill-health
YMCA. (2010). SFC: Submissions. Retrieved November 30, 2010, from The Scottish Parliament: http://www.scottish.parliament.uk/s3/committees/finance/inquiries/preventative/PS-YMCAScotland.pdf
Zeedyk, D. S. (2010, November 2). Finance Committee Official Report. Retrieved November 30, 2010, from The Scottish Parliament: http://www.scottish.parliament.uk/s3/committees/finance/or-10/fi10-2302.htm#Col2609
Zero Tolerance. (2010). SFC Submissions. Retrieved November 30, 2010, from The Scottish Parliament: http://www.scottish.parliament.uk/s3/committees/finance/inquiries/preventative/PS-ZeroTolerance.pdf
[1] Preventative spending is an example of what economists term a 'merit good.' As individuals we are myopic and fail to take into account the long term benefits of demanding and consuming a merit good.
[2] Birmingham city council, for example, calculated that early years investment would yield £10 to the city for every £1 that it spends but only a quarter of that benefit would accrue to the council (Birmingham Total Place Pilot, 2010).
[3] Breastfeeding has been shown to prevent illnesses such as eczema, middle-ear infections, intestinal disorders, respiratory tract infections (such as pneumonia, asthma, diabetes) and sudden infant death syndrome in the infant, for example (Reuters, 2010). It has also been shown to lower the chance of the mother developing such illnesses as heart disease and stroke (BBC News, 2009)
[4] The Every Child a Chance Trust calculates that the cost of poor literacy is estimated to be between £5000-£64,000 for an individual over a lifetime (Save the Children, 2010).
[5] Men in Sweden are eligible for 40 weeks' full-time paid paternity leave, compared with just two days for their British counterparts (BBC News, 2010).
[6] It is estimated nationally that if the number of offences by children and young people was reduced by 1%, it would generate £45 million in savings to households and individuals per year (Nottingham City Council, 2010).
[7] Britain has the fastest growing rate of obesity in the developed world and evidence from Diabetes UK show that obese people are up to 80 times more likely to develop Type 2 diabetes than those who maintain a healthy weight. (Diabetes UK, 2005)
[8] Transform Scotland & Friends of the Earth calculate that less than 39% of adults aged 16 or over in Scotland are meeting the national physical activity recommendation: walking, cycling and public transport to 50% (the same as The Netherlands) could cut obesity rates in half (Transform Scotland, 2010; Friends of the Earth, 2010).
[9] Nevertheless, a lower life expectancy also presents a saving to the state in terms of lower pension contributions.
[10] For some prisoners leaving prison can be a difficult reality check: 1 in 3 will not have somewhere to live and 6 out of 10 employers will automatically exclude individuals with a criminal record (BBC News, 2006).
[11] SROI measures the value of the benefits relative to the costs of achieving those benefits:
[Net present value of benefits]
[SROI] = ———————————————————————————
[Net present value of investment]
The Committee discussed the use of SROI during its inquiry into public procurement and recommended that DFP put in place a suitable model for systematically measuring, evaluating and incorporating wider social value considerations within economic appraisals and business cases in order to inform the public procurement process (CFP, 2010).
[12] Action for Children (2009) found evidence that in some cases there is a weak relationship between the level a country spends and social outcomes. They contest that spending alone cannot explain the UK's poor performance. Although spending on child benefit packages in 2004 in the UK matched that of Scandinavia, there was no associated improvement in outcomes. The organisation suggest that this discrepancy 'may rest not so much in what countries spend, but in the way they spend it... with the UK devoting a disproportionate amount of its investment to means-tested cash transfers and far less on the universal services.' Moreoever, they highlight that unequal outcomes from the UK's economic growth may have undermined the effectiveness of redistributive investment 'given the evidence linking inequality with low levels of social mobility and child well-being' (Action for Children, 2009) From a political standpoint providing a universal service also has the benefit of harnessing universal ownership.
[13] Commentators such as Wilford contend that joined-up government in NI is particularly difficult to establish due to the structure of the executive (2009).
[14] There is debate on whether NI currently has the power to enact such taxes.
[15] The UK government recently lobbied against a similar proposal in Europe (BBC News, 2010).
[16] £16bn in income-related benefits and tax credits goes unclaimed in the UK in a year. (BBC News, 2010)

Paper 000/00 21 January 2011 NIAR 614-10
Economic Impact of
Cuts in Annually
Managed Expenditure
1 Overview
This paper considers the potential economic impacts of the impending cuts to Annually Managed Expenditure in Northern Ireland. It is shown that there is evidence to indicate that the Coalition Government's plans in respect of welfare reform are regressive[1], and will have a particularly detrimental impact upon families with children. Northern Ireland is shown to be particularly vulnerable to these cuts, and, in fact, the evidence indicates that the plans will have a particularly regressive effect locally. Combined with the impending cuts in general public expenditure (i.e. reductions in Departmental Expenditure Limits), and the likelihood of future increases in interest rates, the economic impact of these reforms is likely to be considerable.
Executive Summary
- Annually Managed Expenditure (AME) relates to programmes that are demand-led and difficult to forecast. The largest single element of AME is social security spending, i.e. expenditure on welfare.
- The Coalition Government has announced a radical 'shake-up' of the welfare system in the UK. A total of £11bn was taken out of welfare UK-wide as a result of the Budget and another £7bn was removed in the October 2010 Spending Review. It is estimated that if Northern Ireland is to receive a proportionate share of the £18bn welfare cuts this could amount to some £500m.
- Some of the key elements of the reform include:
- A new 'Universal Credit' will replace the vast majority of current in-work and out-of-work benefits;
- Disability Living Allowance will be replaced with a new 'Personal Independence Payment';
- Housing Benefits will be scaled back via changes in the way benefits are calculated and an increase to the age threshold for the Shared Room Rate;
- Move to the Consumer Price Index (CPI) for the price indexation of benefits, pensions and tax credits.
- A cap on the total amount of benefits a household can claim;
- A package of changes to State Pensions
- There is some evidence to indicate that previous welfare reforms have been associated with improvements in labour market conditions and average incomes. However, many of these examples relate to periods of relative economic stability; applicability to the current environment is thus debatable.
- A potential issue with the Coalition's planned Welfare Reform is that it is underpinned by the assumption of availability of jobs. Whether this is a reasonable assumption, in current economic conditions, is debatable. This is a particularly pertinent issue for Northern Ireland, where labour market conditions are continuing to deteriorate.
- Analysis undertaken by the Institute for Fiscal Studies indicates that, when all UK tax/benefit reform measures are considered (i.e. those announced under New Labour as well as those that resulted from Budget 2010 and Spending Review 2010), the impact will be a regressive one.
- The analysis indicates that, when the distributive effects of welfare reform are assessed on the basis of different family types, it will be particularly painful for families with children. This evidence is unfavourable from a local economic perspective, given the relatively high rate of 'families with children' in Northern Ireland.
- In addition to this demographic factor, NI is likely to be particularly negatively affected by the welfare changes, for a number of reasons:
- High rate of economic inactivity in NI.
- Relative reliance on public sector in NI.
- Economic conditions remain challenging in NI
- Deficiencies in childcare are already a recognised impediment to work in NI; planned reform likely to exacerbate this problem.
- Comparatively high rate of disability in NI, with associated reliance upon Disability Living Allowance (DLA).
- Housing Benefit Reform and Changes to Mortgage Interest Support may have detrimental impact on (already depressed) housing market in NI.
- The Institute for Fiscal Studies has considered the relative impact upon NI; their evidence indicates that, if all measures to be introduced between 2010-11 and 2014-15 are considered, Northern Ireland is expected to undergo the most significant losses in the UK, after London.
- Furthermore, the analysis indicates that the loss for the 'poorest' four quintiles is higher in NI than in the UK as a whole, (but less for the richest quintile). This suggests that the reform may have a particularly regressive effect in NI.
- A number of additional considerations are highlighted in the paper, including:
- The paper is confined to a consideration of cuts in AME and, as such, omits any consideration as to the economic impacts of cuts in general public expenditure (Department Expenditure Limits, DEL); these are considerable and will compound the economic effects of welfare cuts.
- Some of the planned reforms would appear to be in direct contrast with the evidence in favour of Preventative Spending (refer Research Paper presented to Committee on 19th January 2011). For example, the removal of the Sure Start Maternity Grant for a second child and the abolition of the Help in Pregnancy grant (as well as changes to housing benefit and tax credits) will reduce preventative expenditure at what is recognised as the most vital point of intervention (Early Years). The evidence on Preventative Spending suggests that this policy could be costly in the medium to long term.
- The fact that benefits will now be linked to the Consumer Price Index (CPI), rather than the Retail Price Index (RPI) will make future benefits less generous. The CPI does not include mortgage costs, whereas the RPI does – this means that, as interest rates start to increase, consumers will not be compensated for rising housing costs.
2 Introduction
Annually Managed Expenditure (AME) relates to programmes that are demand-led and difficult to forecast. The largest single element of AME is social security spending, i.e. expenditure on welfare[2]. The Coalition Government has announced a radical 'shake-up' of the welfare system in the UK. The plan is a far-reaching one and is likely to result in the most radical reform of the welfare state since its foundation. A total of £11bn was taken out of welfare UK-wide as a result of the Budget and another £7bn was removed in the October 2010 Spending Review. It is estimated that if Northern Ireland is to receive a proportionate share of the £18bn welfare cuts this could amount to some £500m[3].
3 Welfare Reform – Key Changes
It is perhaps worth highlighting, in advance of this discussion, that the term 'welfare reform' implies impending improvements in the system. 'Welfare cuts' is arguably a more accurate term to describe the Government's plans; however, the two terms are used interchangeably in this paper.
A recent Assembly research paper for the Committee for Social Development covered the key aspects of the Coalition Government's plans for welfare reform[4]. Members may also wish to be aware that Assembly Research and Library Services will be publishing a Welfare Reform 'Resource Pack', which will provide links to key Government publications; think tank papers; Assembly Questions, Statements and Debates; and press coverage of welfare reform.
Some of the key elements of the reform include[5]:
- A new 'Universal Credit' will replace the vast majority of current in-work and out-of-work benefits;
- Disability Living Allowance will be replaced with a new 'Personal Independence Payment', which will involve a new 'objective' medical assessment process;
- Housing Benefits will be scaled back via changes in the way the benefit is calculated and an increase to the age threshold for the Shared Room Rate;
- Move to the Consumer Price Index (CPI) for the price indexation of benefits, pensions and tax credits.
- A cap on the total amount of benefits a household can claim;
- A package of changes to State Pensions
The chart below illustrates the relative scale of each broad reform element; it shows the breakdown of the anticipated total savings in 2014-15. It can be seen that the changes in the method of uprating benefits (i.e. the move to the Consumer Price Index) create the largest saving, followed by changes in Child Benefit, Tax Credits and Housing Benefit. There are also considerable savings associated with cuts in Employment and Support Allowance, Disability Living Allowance and other benefits for families with children.
Figure 1: Welfare Cuts to Date under Coalition Government
Source: Institute for Fiscal Studies
A comprehensive list of the changes announced in the June 2010 Budget and October 2010 Spending Review is attached at Table 2 below.
Table 2: At a Glance - Welfare reform announced in June Budget and Spending Review[6][7][8]
| June Budget6 | Spending Review7 (October) |
|
| Child Benefit | A three year freeze on Child Benefit from 2011/12 to help fund significant above indexation increases to Child Tax Credit which the Coalition Government believes is better targeted at low-income families. | From January 2013, a withdrawal of Child Benefit from families with a higher rate taxpayer. The Coalition Government believe that this will save £2.5 billion a year by 2014-15 and will ensure that people in lower incomes are not subsidising those who are better off. |
| Child Trust Fund | The Coalition Government announced on 24 May 2010 its intention to reduce and then stop Government contributions to Child Trust Funds. It reiterated this point in the June Budget and also announced that the Savings Gateway would not be introduced as the Government believed it was not affordable given the need to reduce the deficit. | |
| Capping Benefits | From 2013, a household benefit cap of around £500 per week will be placed on couple and single parent households. A cap of around £350 per week will be imposed on single adult households. The Coalition Government state that the purpose of the cap is to ensure that no family can receive more in welfare than the median after tax earnings for working households. All Disability Living Allowance claimants, War Widows and working families claiming working tax credits will be exempt from the cap. | |
| Contributory Employment and Support Allowance | Time-limiting contributory ESA for those in the Work-Related Activity Group to one year. The Coalition Government believes that this will save £2 billion per year by 2014-15 and will improve work incentives whilst protecting people with the most severe disabilities and those with the lowest incomes. |
| June Budget6 | Spending Review7 (October) |
|
| Disability Living Allowance | The Coalition Government announces that it would reform Disability Living Allowance to ensure support is targeted on those with the highest medical need. It also announced that objective medical assessments for all DLA claimants would be introduced from 2013-14. | The mobility component of Disability Living Allowance will cease to be paid after an individual has been in a hospital or care home for 28 days (84 days for children in hospital)3. |
| Housing Benefit and Local Housing Allowance | The Coalition Government announces that it will introduce a package of reforms to Housing Benefit. This includes changing the percentile of market rents used to calculate Local Housing Allowance rates; capping the maximum Local Housing Allowance payable for each property size; time-limiting receipt of full Housing Benefit for claimants who could be expected to look for work; restricting Housing Benefit for working age claimants in the social rented sector who are occupying a larger property than their household size warrants. From April 2011, Local Housing Allowance rates will be capped at £250 per week for a one bedroom property; £290 for a two bedroom property; £340 for a three bedroom property; and £400 per week for four or more bedrooms. The Government contribution to Discretionary Housing Payments will be increased by £10m in 2011-12 and £40m in each year from 2012-13. From April 2011, Housing Benefit claimants with a disability and non-resident carer will be entitled to funding for an extra bedroom. From April 2013, Housing Benefit awards will be reduced to 90% of the initial award after 12 months for claimants receiving Jobseekers Allowance. [Note: on the 30 November the Coalition Government announced two changes to the timetabling of some of the reforms to provide additional transitional time for existing claimants9: | The Coalition Government announce an increase to the age threshold for the Shared Room Rate in Housing Benefit from 25 to 35. It believes that this will save £215m a year by 2014-15 and will ensure that Housing Benefit rules will reflect the housing expectations of people of a similar age not on benefits. |
| June Budget6 | Spending Review7 (October) |
|
| All changes that will adjust the way Local Housing Allowance rates are calculated will come into force from April 2011 for new claims. Existing claimants will continue at their current rate of benefit until their claim is reviewed, they will then have a further period of transitional protection at their current Local Housing Allowance rate of up to nine months if there has not been a relevant change in circumstances.] | ||
| Indexation | From April 2011, the Coalition Government will use the Consumer Price Index (CPI) for the price indexation of benefits and tax credits. The Government states that CPI provides a more appropriate measure of benefit and pension recipient's inflation experiences than the Retail Price Index (RPI). | |
| Maternity Payments | The Coalition Government announce that from April 2011, eligibility for Sure Start Maternity Grant will be restricted to the first child only and that the Health in Pregnancy Grant will be abolished from January 2011. | |
| State Pensions, Pension Credit and State Pension Age | The Coalition Government will uprate the basic State Pension by a triple guarantee of earnings, prices or 2.5 per cent, whichever is highest, from April 2011. CPI will be used as the measure of prices in the triple guarantee, as for other benefits and tax credits. However, the Government has stated that to ensure the value of a basic State Pension is at least as generous as under the previous uprating rules, the basic State Pension in April 2011 by at least the equivalent of RPI. The Coalition Government also announce that to ensure the lowest income pensioners benefit from the triple guarantee, the standard minimum income guarantee in Pension Credit will increase in April 2011 by the case rise in a full basic State Pension. | The Coalition Government announce a freeze in the maximum Savings Credit award in Pension Credit for four years, thereby limited the spread of means-testing up the income distribution. The Government believes that this will save £330m a year by 2014-15. The Government also announce acceleration in the pace of State Pension Age equalisation. Women's State Pension Age will reach 65 in November 2018. The State Pension Age will then increase to 66 for both men and women from December 2018 to April 2020. The Government states that it is also considering future increases to State Pension Age to manage the ongoing challenges in response to the UK's changing demographics. |
| June Budget6 | Spending Review7 (October) |
|
| Support for Mortgage Interest | The rate at which Support for Mortgage Interest (SMI) is paid is set at 1.58% above the Bank of England Base Rate. It has been frozen at 6.08% since late 2008. The Government maintain that since interest rates have fallen significantly, SMI will, from October 2010, be paid at the level of the Bank of England's published Average Monthly Rate. | The Coalition Government announce the extension of a further year the temporary change to the Support for Mortgage Interest (SMI) scheme, i.e. reducing the waiting period for new working age claimants to 14 weeks and the increase in the limit on eligible mortgage capital to £200,000. These temporary measures were due to expire by January 2011. |
| Tax Credits | By April 2011, a reduction in tax credit eligibility for families with household income above £40,000. The Coalition Government announces that further changes to this threshold will be made in 2012-13 to focus tax credits on lower income families. It also announces that it would also increase the rate at which tax credits are withdrawn once household income rises. In his budget speech the Chancellor announces that the Government would10:
|
By April 2011, a reduction in the percentage of childcare costs that parents can claim through the childcare element of the Working Tax Credit from 80% to its previous 70% level. The Government believes that this will save £385m a year by 2014-15. A change in the eligibility rules so that couples with children must work 24 hours a week between them, with one partner working at least 16 hours per week in order to qualify for WTC. The Government believe that this will save £390m a year by 2014-2015. A freeze in the basic and 30 hour element of Working Tax Credit for three years from 2011-2012. The Government believes that this will save £625m a year by 2014-15. |
| June Budget6 | Spending Review7 (October) |
|
| Universal Credit | The Coalition Government announces that over the next two Parliaments the complex system of means tested working age benefits and tax credits will gradually be replaced by Universal Credit. £2 billion has been set aside in DWP's Departmental Expenditure Limit settlement over the next four years to fund the implementation of Universal Credit. | |
| Winter Fuel Payments and Cold Weather Payments | The Coalition Government gives a commitment to protect key benefits for older people including Winter Fuel Payments. | The Coalition Government states that it will make permanent the temporary increases to Cold Weather Payments provided in the past two winters so that eligible households receive £25 for each seven day cold spell recorded or forecast where they live (temperature eligibility criteria applies). |
4 What are the Economic Implications of Welfare Cuts?
4.1 The Link between Welfare and the Economy
Occasionally, there is a perceived dichotomy between 'welfare' and 'economy'; however, the two are intricately linked. One of the key objectives of the welfare system was, and is, to maintain purchasing power[12]. The cuts in welfare benefits will have a detrimental impact on the private sector (both in terms of output and employment), due to reduced consumer spending power. According to the International Labour Organisation[13] cutting welfare benefits "may not only directly affect social security beneficiaries, and consequently the standards of living of a large portion of the population but also, through aggregate demand effects, slow down or significantly delay a full economic recovery".
4.2 What does the Existing Literature Say?
There is a body of literature which examines the economic impact of previous reforms of welfare states. One such example relates to the mid to late 1990s, when the then President, Bill Clinton, overhauled the United States' welfare system. In 1996, Congress passed the Personal Responsibility & Work Opportunity Reconciliation Act (PRWORA). This legislation sought to:
1. Reduce welfare dependence and increase employment
2. Reduce child poverty
3. Reduce illegitimacy
At the time there was considerable opposition to the legislation, with opponents claiming that it would lead to an increase in poverty and other social evils. However, the Act has been shown to have been associated with improvements in each of the key areas[14]. Outcomes that were associated[15] with the passing of the Act include[16]:
- An increase in workforce participation
- An increase in the average income levels of less-skilled single mothers
- A reduction (to a historically low level) of poverty amongst single mothers.
Therefore, there is some evidence to indicate that previous attempts at welfare reform have been associated with improvements in labour market conditions and average incomes. However, there is a significant difference between the policy adopted by US Congress in the 1990s and the current plans of the Coalition Government; namely the economic environment. Much of the success of the PRWORA legislation might be attributed to the strong economy in the US in the 1990s[17].
For further examples of 'successful' welfare reform, Members may wish to refer to a previous Assembly Research paper, Rebalancing Public Finances: Lessons from Past Experiences[18]. This provides additional evidence that the scaling back of benefits can, in fact, result in economic progress. However, many of these examples relate to periods of relative economic stability; their applicability to the current environment is thus debatable.
In contrast with the above evidence, there is another body of literature which suggests that forcing people from social assistance into the paid workforce will depress wages within the low wage workforce[19]. This argument implies that welfare cuts harm not only those on social assistance, but also the working poor. Research by economist Robert Solow into the consequences of moving welfare recipients into the US workforce indicated that[20]:
- Wages can be expected to decline in response to the movement of welfare beneficiaries into the workforce;
- However, it is not necessarily the case that a huge demand for unskilled workers will materialise if wages fall enough (i.e. there are constraints upon employment prospects).
A potential issue with the Coalition's planned Welfare Reform is that it is underpinned by the assumption of availability of jobs. Whether this is a reasonable assumption, in current economic conditions, is debatable. This is a particularly pertinent issue for Northern Ireland, where labour market conditions are continuing to deteriorate[21].
4.3 Distributional Effects of Planned Welfare Reform: Who Will Bear the Brunt?
Impact of Measures announced in Budget 2010
The Chancellor described the June 2010 Budget as a 'progressive' one, (meaning that it would hit high earners hardest, whilst relatively protecting those on low incomes). However, the Institute for Fiscal Studies (IFS) has produced evidence which is inconsistent with this. In considering the wider effects of benefit changes announced in the Budget, the IFS concludes that "our analysis shows that the overall effect of the new reforms announced in the June 2010 Budget is regressive."
As illustrated in Figure 3, the pre-announced changes (i.e. those attributable to previous Government) to taxes and benefits are progressive and will particularly affect the richest tenth of households[22].
However, measures that were announced by the Coalition Government in the June 2010 are estimated to be regressive, with the lowest income groups losing out the most and higher earners in fact benefitting from the reforms. Figure 4 shows that the changes to be introduced by 2014 are also regressive within the bottom 90% of earners. However, the richest 20% of households lost the most both in cash and percentage terms.
Figure 3: The Effect of Direct Tax and Benefit Reforms to be introduced between June 2010 and April 2012 by Household Income Decile Group
Source: IFS
Figure 4: The Effect of Direct Tax and Benefit Reforms to be introduced between June 2010 and April 2014 by Household Income Decile Group
Source: IFS
Impact of Measures announced in Spending Review 2010
Work carried out by the Institute for Fiscal Studies suggests that the measures that were announced in the October 2010 Spending Review are also regressive, when considered over the period until 2012-13[23]. Figure 5 shows that the Spending Review announcements will be particularly painful for the 'poorest half' of the population (income declines 1 (Poorest) to 5). The cuts are regressive both on the basis of HM Treasury's analysis (the red line shown on Figure 5) and that of the IFS.
Figure 5: Distributional Impact of Welfare Measures Announced in the Spending Review to be in place by 2012-13[24]
Source: IFS
However, the plans are less regressive when considered over the period until 2014-15 (by which time Child Benefit cuts will have been fully implemented). Figure 6 shows that the distributional impact of the measures is slightly more evenly allocated when considered over this longer time period[25]. However, the top income deciles (the wealthiest members of the population) continue to be comparatively protected from the effect of the cuts; the richest category loses approximately 0.3% of income, whereas the poorest lose almost 1.2%.
Figure 6: Distributional Impact of Welfare Measures Announced in the Spending Review to be in place by 2014-15[26]
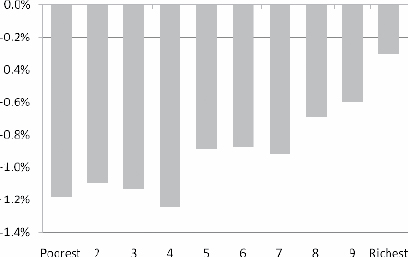
Impact of All Measures (Including those that were 'Pre-announced'[27])
When all tax/benefit reform measures are considered (i.e. those announced under New Labour as well as those that resulted from Budget 2010 and Spending Review 2010), the IFS estimates that the impact will be a regressive one. Figures 7 and 8 indicate that:
- Reforms to be implemented by 2012-13 are slightly regressive or flat within the bottom 90% of households (i.e. with the exception of the 'richest', or 10th, decile);
- Reforms by 2014-15 are more obviously regressive within the bottom 90%;
- The regressive impact is the result of reforms announced by the current Government, both in the Budget 2010 and in Spending Review 2010.
Figure 7: Distributional Impact of Tax and Benefit Measures to be in Place by 2012-13
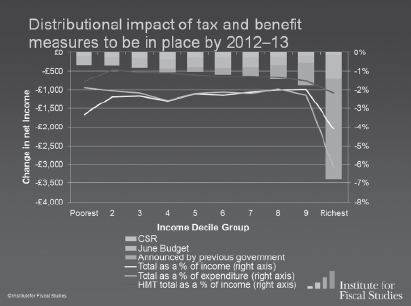
Figure 8: Distributional Impact of Tax and Benefit Measures to be in Place by 2014-15
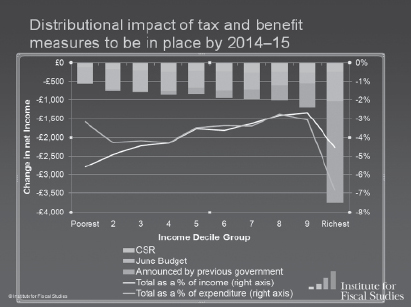
Impact By Family Type
When the distributive effects of welfare reform are assessed on the basis of different family types (Figure 9), it emerges that Welfare Reform will be particularly painful for families with children.
Figure 9: Distributional Impact of Measures to be in Place by 2014-15 by Family Type
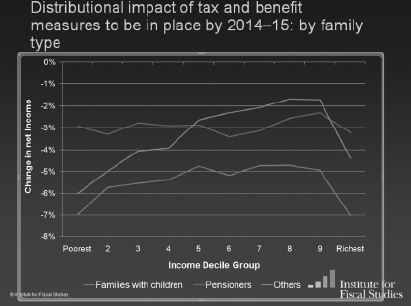
This evidence is unfavourable from a local perspective, given the relatively high rate of 'families with children' in Northern Ireland[28]. This implies that the cuts will be relatively burdensome for NI in that a greater proportion of the population will be exposed to the largest losses.
4 A Disproportionate Impact on Northern Ireland?
4.1 A Relative Vulnerability?
Northern Ireland is likely to be particularly negatively affected by the welfare changes, for a number of reasons:
- Northern Ireland has a particularly high rate of economic inactivity, meaning that a relatively large proportion of the population will be affected by the proposed reforms.
- Relative reliance on public sector in Northern Ireland. The impending cuts in public expenditure (Departmental Expenditure Limits, DEL) will thus have a disproportionate impact on NI, compounding the effects of welfare cuts (AME).
- Much of the reform in respect of unemployment benefits appears to presume the availability of surplus employment. The validity of this assumption is debatable in the current economic climate, particularly in NI, given our relatively small private sector (and associated inability to 'pick up the slack' from public sector cuts and/or job losses) and the fact that labour market conditions are continuing to decline[29].
- NI has a relatively high proportion of households with children (as shown in figure 9 above); the IFS analysis indicates that this group will particularly lose out from the impending tax and benefits reform.
- Economic conditions remain challenging in NI unlike in many other UK regions that are officially 'in recovery'.
- Deficiencies in child care are already a recognised impediment to work. There is a lack of developed infrastructure for child care in NI, with no lead government department and no statutory duty on public authorities to provide adequate childcare. A survey by Employers for Childcare among unemployed women found that a lack of suitable childcare was the most significant barrier to finding work[30]. This will be exacerbated by proposed reduction in Working Tax Credit to help with child care costs, from 80% to 70%. The planned reform is underpinned by the assumption that there is sufficient, accessible childcare in place; it could be argued that this is not the case in NI.
- There is a comparatively high rate of disability in Northern Ireland, with an associated reliance upon Disability Living Allowance (DLA). As of 31 May 2010, there were 183,710 claimants in Northern Ireland, representing the highest rate in the UK (refer Table 10). At a rate of 102.7 claimants per 1,000 members of the population, approximately 1 in 10 people claim DLA in Northern Ireland; this compares to almost half the number of claimants (1 in 5 approximately) in Great Britain. This makes a relatively high proportion of the local population particularly vulnerable to the reform of DLA benefits.
Table 10: Disability Living Allowance by Region (31 May 2010)
| Country/Government Office Region | Allowances ('000s) | Allowances per 1,000 population |
| Great Britain | 3,157.3 | 52.6 |
| Unallocated | 3.4 | |
| England | 2,569.8 | 49.6 |
| North East | 176.2 | 68.2 |
| North West | 473.5 | 68.6 |
| Yorkshire and Humber | 295.2 | 56.1 |
| East Midlands | 230.9 | 51.9 |
| West Midlands | 303.2 | 55.8 |
| East | 226.9 | 39.3 |
| London | 315.7 | 40.7 |
| South East | 311.8 | 37.0 |
| South West | 236.4 | 45.2 |
| Wales | 242.0 | 80.7 |
| Scotland | 342.4 | 65.9 |
| Northern Ireland | 183.7 | 102.7 |
Source: Department for Social Development, Disability Living Allowance, Summary of Statistics. 31 May 2010[31]
- Housing Benefit Reform and Changes to Mortgage Interest Support may have detrimental impact on local housing market. Having experienced an extreme spike in prices, the Northern Ireland property market has since undergone severe price corrections; and unlike in many other UK regions, prices are continuing to fall. Many homeowners are already struggling with repayment capacity and the prospect of repossession. This may be exacerbated by the planned reform of Housing Benefit and reduction in Mortgage Interest Support from 6.08% to approximately 3.63%[32].
Changes to the way in which Housing Benefit will be calculated will be detrimental for many claimants (refer Assembly Research Paper on Welfare Reform, p.31)[33]. In economic terms, the effect of lowering benefits will be to reduce individuals'/families' spending power, with detrimental effects for the local private sector and wider economy. Furthermore, it is possible that landlords may face rising rent arrears as tenants' benefits are reduced and they struggle to meet payments (although this is likely to be a short-term issue as tenants would eventually move to more affordable housing, either voluntarily or by eviction order).
4.2 Estimated Impact on Northern Ireland
According to the Minister for Social Development, the extent of the impacts will be as follows[34]:
- Some 7,500 people (out of 15,000 recipients) will be disadvantaged by the impact of the reduction in mortgage interest support[35] to 3.63%;
- Over 1,000 people will be affected by the change to baby tax credit;
- Approximately 454 households will be affected by local housing allowance monetary caps;
- Around 7,200 households will be affected by the removal of the excess payment of £15;
- The change in the setting of the rate to be consistent with rents in the thirtieth percentile will affect 38,000 people who are in receipt of housing benefit.
The Department for Social Development has commissioned work into the estimated economic impacts of welfare reform in Northern Ireland; this should be useful in quantifying the effects of the cuts, however, this research is yet to be published.
In the absence of this analysis, the only body of evidence appears to be that provided by the Institute of Fiscal Studies. The IFS examined how the average loss from tax and benefit reforms in Northern Ireland might differ, if at all, from the UK average. It also considered NI households by income quintiles and compared the effects of welfare reform on each with those of the UK counterparts. Figure 11 below shows that when the analysis is restricted to an examination of the period between 2010-11 and 2012-13, the effects are broadly similar across UK regions (with the exception of London[36]).
Figure 11: The effect of all tax and benefit reforms to be introduced between 2010-11 and 2012-13 by region
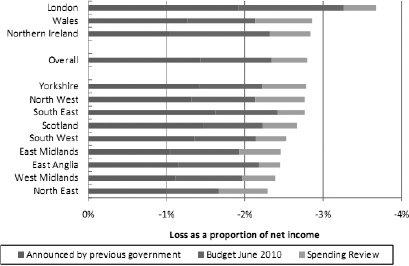
Source: IFS
However, when the analysis is extended to encompass all measures to be introduced between 2010-11 and 2014-15, it is estimated that Northern Ireland will fare particularly badly (Figure 12). Northern Ireland is expected to undergo the most significant losses in the UK between 2010-11 and 2014-15, after London.
Figure 12: The effect of all tax and benefit reforms to be introduced between 2010-11 and 2014-15 by region
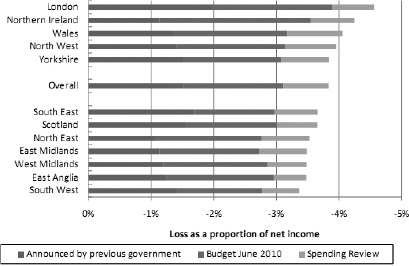
Source: IFS
If households are divided into quintile groups based on income levels, analysis by the IFS indicates that the loss for the poorest four quintiles is higher in Northern Ireland than in the UK as a whole, but less for the richest quintile (refer Figures 13 and 14). As discussed above, this is because the poorest households in NI lose more from the reform of DLA, whilst the richest households are less affected than those in the UK due to lower average income levels.
Figure 13: The effect of tax and benefit reforms to be introduced between 2010-11 and 2014-15 by UK household income quintile group
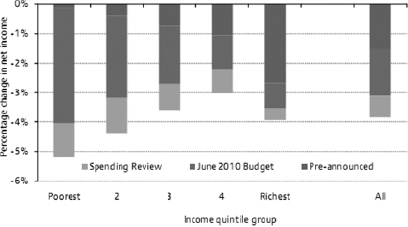
Figure 14: The effect of tax and benefit reforms to be introduced between 2010-11 and 2014-15 by UK household income quintile group, NI households only
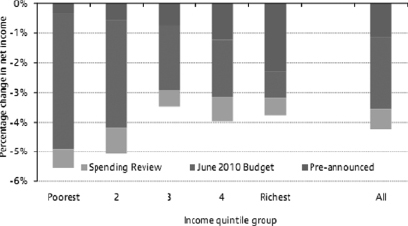
4.3 Additional Considerations
- It is perhaps worth re-iterating that this paper is only concerned with cuts in Annually Managed Expenditure (AME). As such it omits any consideration as to the economic impacts of cuts in general public expenditure (Department Expenditure Limits, DEL); these are considerable and will compound the economic effects of welfare cuts.
- Furthermore, the potential impacts do not account for the inevitability of future interest rate hikes (given ongoing inflationary pressures). This will further erode income levels with a detrimental impact on consumption/expenditure.
- Members of the Committee are aware of the evidence which exists in respect of the potential financial benefits associated with Preventative Spending (refer Research Paper presented to Committee for Finance and Personnel on 19th January 2011). It is perhaps worth highlighting that elements of the planned reform are in direct contrast with this evidence. For example, the removal of the Sure Start Maternity Grant for a second child and the abolition of the Help in Pregnancy grant (as well as changes to housing benefit and tax credits) will reduce preventative expenditure at what is recognised as the most vital point of intervention (Early Years). The evidence on Preventative Spending suggests that this policy could be costly in the medium to long term.
- The most significant change to welfare policy is arguably the announcement in the June 2010 budget that benefits would be linked to the Consumer Price Index (CPI), rather than the Retail Price Index (RPI) or Rossi Index from April 2011. This will make future benefits less generous, (refer Table 13). It is estimated that moving to this index will save the Government £1.2bn in 2011-12, rising to £5.8bn in 2014-15[37]. The CPI does not include mortgage costs, whereas the RPI does[38] – this means that, particularly as interest rates start to increase, consumers may not be fully compensated for inflationary pressures in respect of the cost of housing.
Table 13: Average Forecasts for RPI and CPI in 2011
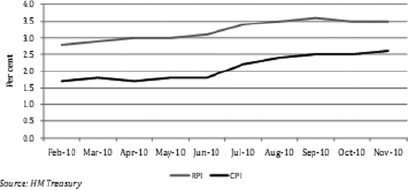
[1] Meaning that they will have a disproportionate impact on the poorest members of society.
[2] HM Treasury - http://www.hm-treasury.gov.uk/psr_spend_plancontrol.htm#ame
[3] Debate on Welfare Reform, Northern Ireland Assembly, 23 November 2010
According to PwC, the figure is slightly lower at £400m – ass per private correspondence with Esmond Birnie, Chief Economist, PWC
[4] An Introduction to Welfare Reform, NI Assembly Research Paper, January 2011
[5]An Introduction to Welfare Reform, NI Assembly Research Paper, January 2011
[6] Budget 2010, HM Treasury.
[7] Spending Review 2010, HM Treasury.
[8] As cited in Department for Work and Pension (2010) Disability Living Allowance reform, p15.
[9] Written Ministerial Statement on Housing Benefit Reform, 30 November 2010. www.publications.parliament.uk/pa/cm201011/cmhansrd/cm101130/wmstext/101130m0001.htm#10113032000021
[10] Chancellor's June 2010 Budget Speech. www.hm-treasury.gov.uk/junebudget_documents.htm
[11] Field, F. (2010) The Foundation Years: preventing poor children becoming poor adults. The Report of the Independent Review on Poverty and Life Changes. http://povertyreview.independent.gov.uk/media/20254/poverty-report.pdf
[12] Sustaining social order was another key objective of the welfare system (as per Prof. Evason, NICVA seminar, Jan 2011)
[13] http://www.ilo.org/public/english/region/eurpro/moscow/news/2010/1116.htm
[14] The Impact of Welfare Reform, The Heritage Foundation, July 2006
[15] I use the term associated to allow for the fact that causation has not been conclusively proven – whilst these outcomes were associated with the legislation, it is possible that there were also attributable to other economic or social factors that occurred concurrently.
[16] Declining Caseloads/Increased Work, Blank, R, University of Michigan, October 2000
[17] The Impact of Welfare Reform, The Heritage Foundation, July 2006
[18] Published on Assist – October, 2010
[19] Depressing Wages¸ Canadian Centre for Policy Alternatives, March 2001
[20] Work & Welfare, Solow, R., Princetown, 1998
[21] Figures for December 2010 showed that the number of unemployment benefit claimants increased by 300 from the previous month's revised figure
http://www.northernireland.gov.uk/index/media-centre/news-departments/news-deti/news-deti-190111-foster-comments-on.htm
[22] This is principally due to increases in National Insurance rates and the restriction of tax relief on pension contributions for high-income individuals
http://www.ifs.org.uk/bns/bn108.pdf
[23] This is in contrast with HMT's assessment that whilst welfare changes were regressive, the overall package of tax and benefit changes by 2012-13 is progressive. The reason for the difference is that, on the assertion that there was not sufficient data to attribute changes in tax, tax credits or benefits to individuals, HMT did not account for Housing Benefit, Employment and Support Allowance, Disability Living Allowance, Council Tax Benefit, or the way in which in-year income changes affect tax credit awards. The IFS has estimated the distributional impact of these changes – accordingly, whilst their estimates may be less precise, they should be more complete.
www.ifs.org.uk/publications/5313
[24] This shows the change in net income by each income decile group
[25] It should be noted that the remaining omission from this analysis is the impact of the Universal Credit
[26] This shows the change in net income by each income decile group
[27] I.e. those that were announced by previous Government
[28] According to the IFS, there is a particularly high rate of families with children in NI
The Impact of Tax and Benefit Reforms to be Introduced between 2010-11 and 2014-15 in NI, Institute of Fiscal Studies, 2010
[29] http://www.northernireland.gov.uk/index/media-centre/news-departments/news-deti/news-deti-190111-foster-comments-on.htm
[30] The Childcare Barrier, Kinnear, H., Employers for Childcare, 2003
[31] As cited in An Introduction to Welfare Reform, NI Assembly Research Paper, January 2011
[32] As outlined in Table 2, the rate at which Support for Mortgage Interest (SMI) is currently paid is set at 1.58% above the Bank of England Base Rate (it has been frozen at 6.08% since late 2008). However, as part of the June 2010 Budget the Coalition Government announced that since mortgage interest rates have fallen considerably, the rate of SMI will be paid at the level of the Bank of England Average Monthly Rate (approximately 3.63%)
[33] An Introduction to Welfare Reform, NI Assembly Research Paper, January 2011
[34] Welfare Reform, Northern Ireland Assembly, 23 November 2010
[35] As outlined in table 2, the rate is being reduced to 3.63%
[36] London has a disproportionately large share of the richest individuals in the UK. Households located there are also particularly affected by the cuts to Housing Benefit because London is a high rent area.
[37] Based on compounded savings.
The Distributional Effect of Tax and Benefit Reforms to be introduced between June 2010-April 2014: a Revised Assessment, Institute of Fiscal Studeis,
[38] http://www.statistics.gov.uk/articles/nojournal/CPI_and_RPI_The_2010_Basket_of_Goods_and_Services.pdf
Research and Library Service briefings are compiled for the benefit of MLAs and their support staff. Authors are available to discuss the contents of these papers with Members and their staff but cannot advise members of the general public. We do, however, welcome written evidence that relate to our papers and these should be sent to the Research & Library Service, Northern Ireland Assembly, Room 139, Parliament Buildings, Belfast BT4 3XX or e-mailed to RLS@niassembly.gov.ukAppendix 8
Other Papers
Construction Employers Federation
Report on the Use of Private Finance for
Procuring Public Sector Services
June 2010
Table of Contents
1.0 Introduction
2.0 Key Issues
3.0 Resolving the Key Issues
3.1 On/Off Balance Sheet
3.2 Windfall Profits/Project Returns
3.3 Funding Issues
3.4 Employment Issues
3.5 Operational Flexibility
3.6 Governance
3.7 Design Issues
3.8 Business Case Approval & Procurement
3.9 Sustainability
3.10 Asset Swaps
4.0 The Northern Ireland Revenue Finance Partnership Model
5.0 Conclusion
1.0 Introduction
The Construction Employers Federation (CEF) recognises that current market conditions make the procurement of capital projects increasingly uncertain, raising concerns for the future of the Northern Ireland construction industry.
The CEF is particularly concerned that a lack of continuing investment in much needed infrastructure across all sectors including transport, water, health and education will hamper Northern Ireland's future competitiveness.
Given the expected cuts in future public capital spending, the CEF is keen to explore the potential use of private sector innovation, skills and funding for the delivery of public sector infrastructure projects.
We have focused our attention at this stage on the existing Public Private Partnership (PPP) model. In particular we are focussing on large capital projects that are designed, built, financed and operated over a period of 25 to 30 years.
Through a series of ongoing discussions with leading industry figures, public organisations and financial organisations, we are critically examining the various concerns that exist so that they can be addressed and a more attractive model developed.
The CEF propose that private sector funding is utilised through an asset based revenue generating model. This should enable much needed investment to be brought forward to deliver much needed infrastructure and at the same time maintain and create employment in the construction industry.
2.0 Key Issues
The overriding concerns regarding use of Public Private Partnerships are as follows:-
On/Off Balance Sheet Treatment
In the recent past PPP Projects were considered "on balance sheet" for public sector accounting purposes. This had a direct detrimental impact on departmental capital expenditure and therefore mitigated against the use of PPP.
Windfall Profits/Project Returns
There is an ongoing belief in the public sector that PPP's generate excess profits for investors.
Funding Issues
Due to the increased costs of finance there are concerns at the current low level of market interest in PPP projects. Underlying government security enables the public sector to borrow at lower rates than private organisations.
Labour
There is wide spread concern largely voiced by the trade unions that PPP projects result in a loss of employment and the division of the work force in to two tier structures.
Sustainability
There is a perception that PPP projects do not sufficiently take account of sustainability issues.
Operation Flexibility
The public sector believes that the current PPP model is not sufficiently flexible when it comes to required changes. They are of the view that required changes often lead to claims from the private sector in excess of market cost levels.
Governance
There is concern in the public sector as to the management and control of the "asset" and its use to generate excess profit without appropriate transparency for the public sector.
Design Issues
There is a perception that PPP projects lead to poor design with associated quality issues. There is concern that these issues serve to prolong the procurement process.
Business Case Assessment & Procurement
The whole procurement process is very time consuming and costly for both the public and private sectors.
3.0 Resolving the Key Issues
The PPP Market in the UK is "mature". It has evolved, changed and adapted as issues arose. The model is still regarded as a useful procurement tool and both government and the private sectors are working hard to resolve the issues that exist.
This work has been tackled in variety of ways by UK, Northern Ireland, Scottish and Irish governments however to date there has been no overarching and co-ordinated solution.
This report attempts to address the principal issues outlined above and suggests a model that could be attractive for the delivery of Northern Ireland's much needed infrastructure.
3.1 On/Off Balance Sheet
This issue has largely been resolved through the adoption by HM Treasury of European Systems of Accounts (ESA) for the compilation of public borrowing figures.
This system of accounting allows a level of subjectivity in analysing on/off balance sheet issues. On a simplistic basis, provided the project can demonstrate two out of three "risk transfers" i.e. construction, operation or demand it can be considered "off balance sheet". This change should allow Northern Ireland procurers to utilise PPP more effectively without having a detrimental effect on annual capital budgets.
It must be recognised that a shift from on to off balance sheet does not automatically resolve all the issues. The removal of the capital requirement from budgets will be helpful, however full consideration must be given to the long term revenue implications.
A mix of capital and revenue budget commitments in an obvious solution.
3.2 Windfall Profits/Project Returns
The perception of windfall profits on PPP projects is to some extent distorted by the refinancing "gains" made over the last number of years in advance of the credit crunch. Early projects were financed at relatively high interest rates largely due to the immaturity of the market. When refinanced at the top of an "aggressive" market these resulted in significant gains.
Such gains were largely confined to very early PPP deals. Market maturity and economic pressures forced interest rates down. At the same time windfall gain and revenue sharing mechanisms were introduced. All PPP projects now include complex and robust refinance profit sharing mechanisms.
In the case of tolled roads in the ROI, revenue sharing mechanisms cap agreed levels of return. In this case the market is incentivised to maximize the flow of windfall profits to the client.
A recent development in the Scottish market involves returns to investors being capped and any windfall profits are reinvested into the project or revert back to government.
It is generally accepted by the market that a return capping mechanism is the way forward; however there is a broad consensus that the private sector still needs to be incentivised to ensure that they continue to deliver efficiencies. We therefore propose a three tier structure of capping:-
1. A minimum return level is established by the client.
2. A process is developed whereby uplifts will be shared by both parties. This could be developed on the basis that the higher the windfall the greater percentage that goes to the client.
3. A level be established beyond which all windfall profits go to the client.
The actual mechanism could be established rigidly by the client; however, it may be more appropriate that the client sets the minimum and maximum levels with the tendering parties, proposing the level of windfall profit sharing as part of the competition process. A number of cases exist where this type of structure has been created e.g. the revenue sharing mechanism utilised in the recent Motorway Service Station PPP in ROI or the LIFT/BSF projects in the UK.
3.3 Funding Issues
The finance market is still in difficulty and the availability of finance for construction related projects is available albeit limited. This has created problems for both the private and public sectors. Solutions have been found but these have resulted in very protracted negotiations with finance houses.
The pension fund market represents a significant untapped source of funds and in our opinion, a mechanism needs to be developed that would encourage their participation.
One way to address the high cost of funding and satisfy pension fund security issues would be to provide Government (NI Assembly) guarantees on the debt provided.
Such guarantees can be partial or full depending on the project but would ensure the repayment of the debt in specific circumstances such as for example the termination of the contractor.
At present the funding providers rely indirectly on a government covenant when supporting these projects. A direct government guarantee would however open up the market and allow funds to flow much more easily.
3.4 Employment Issues
Concerns regarding the creation of a "two tier" workforce with significant employment losses as a result of a transfer from the public to the private sector have long since been dealt with.
Initiatives such as those introduced in some health deals have been accepted by the workforce and have proved successful. We believe suitable initiatives can be put in place to meet government targets in efficiency and standards while securing employment.
3.5 Operational Flexibility
This has been an aspect of PPP that has proved to be one of the most controversial as clients find the ability to introduce changes are costly and expensive. . While advances have been made in this are we believe further development is possible so that all parties understand the procedure.
Some recent contracts have included a process for clients to "bench mark" change options and to have them delivered by third parties. While controversial to the private sector this introduces a level of control and is being considered by the market on certain projects.
Other solutions could include break-clauses where terms and conditions for buyout would be pre agreed and included in the signed contract. The ideal is to move to a Strategic Partnership with the Public sector to enhance overall service delivery.
3.6 Governance
Where the public sector have concerns as to the management of the PPP project and particularly where asset transfer is included as part of the process, a board position and voting rights can be ascribed to a public sector representative.
The Scottish Non Profit Distributing (NPD) model includes a requirement for a Public Interest Director to sit on the board with powers to manage conflicts of interest and require the refinancing of senior debt within defined principles.
There is no reason why a similar mechanism could not be applied in Northern Ireland.
3.7 Design Issues
There are suggestions and working practices within public sector procurement that advocate the use of fixed design contracts let to the private sector so as to control the quality of design.
While this helps the certainty of design, it turns the procurement competition into a pricing competition and this can serve to stifle innovation, efficiency and design development.
What is needed is that procuring bodies provide clear details of requirements from the project inception so that design quality is achieved.
3.8 Business Case Approval & Procurement
There is a clear need to streamline the PPP project business review process together with the procurement procedure for such projects.
Standardised contracts should be used. Equally importantly, a dedicated project team needs to be established, appropriately trained and given ownership of the process.
Examples of this can be seen in the National Development Finance Agency (NDFA) in the Republic and in the Scottish Futures Trust (SFT).
A centralised procurement unit with ownership and direct responsibility for delivery of all major departmental projects would deliver efficiencies and provide confidence to the market. This unit should have an agreed and transparent programme of the projects to be delivered and the timescale involved. It should be responsible for business case approval, procurement, negotiation and implementation.
3.9 Sustainability
These issues could be dealt with by ensuring employment, social and environmental issues are clearly laid out in the procurement documents.
3.10 Asset Swaps
One of the major areas where the NI Assembly could contribute to the "fast tracking" of projects would be to utilise their current assets and introduce these to projects (land and buildings). Value could be gained to help fund new projects provided suitable claw back mechanisms were put in place.
3.11 Infrastructure Fund/Bank
The Federation is aware of the introduction of an Infrastructure Fund to support projects that are struggling to secure project funding. We are also aware of increasing calls for a specialist infrastructure bank to finance and promote infrastructure. The Federation believes that consideration should be given to a regional infrastructure funding vehicle that would support much needed local infrastructure. This vehicle could hold public assets and could be used to provide debt finance to projects
4.0 The Northern Ireland Revenue Finance Partnership Model
Taking the above issues into consideration the CEF believe a model can be put in place for use in Northern Ireland.
This model would include;
- A dedicated cross departmental major projects procurement team with full ownership of project delivery.
- A streamlined business case approval process.
- The use of off-balance sheet rules to enable projects to be advanced.
- A capping mechanism for windfall profits.
- A Government full or partial guarantee to encourage pension market participation and minimise finance costs.
- The use of assets to "anchor" the project or provide leverage for funding. An agreed claw back mechanism would be included to safeguard against market benefit.
- Employment issues would be dealt with by using agreed systems of transfer as already developed and accepted by the market.
- Quality of design would be ensured by fixing the design concept for the process or ensuring sufficient specifications are included in the procurement documentation.
- Operational flexibility would be provided by including a third party benchmarking exercise for changes or agreed break clauses.
- Governance would be managed by the inclusion of a public sector representative (with limited powers) on the project execution board.
- Sustainability issues would be managed by incorporating these requirements into the procurement documentation early in the process.
- Use of private sector innovative and management skills to deliver service efficiencies.
5.0 Conclusion
The construction industry is facing very challenging times over the next two to three years. The loss of the development by private sector and budget cuts in the public sector will have a severe impact on the industry and economy at large.
Projects need to be fast-tracked to provide the stability and sustainability within the economy as a whole.
The CEF believe a new Public Partnership model which taps into the private sector skills efficiencies and finance can be developed which will deal with concerns across the public sectors and enable projects to be advanced.
In order to progress this initiative a high level of support is needed to ensure the model is supported and delivered.
Derry City Council
NIO End Year Funding
Statement from NIO Spokesperson on End of Year Funding
Any money that has not been spent by Departments but carried over for use in future years is known as End Year Funding (EYF).
To help tackle the record deficit that the country inherited, the Chancellor announced in June that, regrettably, it was necessary to change the rules on EYF across government.
However the special circumstances of the Devolved Administrations, including Northern Ireland, were recognised by the Treasury.
And so the Treasury agreed to honour the amount of EYF for NI for the current year.
This amounts to some £217m and has been agreed with the Executive.
It has also been agreed – exceptionally – that if the Executive wishes to carry over money to the next financial year it may do so if the cut in spending in the current year is agreed in advance.
This exception applies only to the Devolved Administrations and not to Whitehall Departments.
The Treasury are also standing by their commitment given at the time of the devolution of Policing and Justice that any under spends by the Department of Justice may be carried over to future years.
Presbyterian Mutual Society Savers Lobby Group
PMS Savers Lobby Group NI & ROI
83 Diamond Road Dromore County Down BT25 1PJ
Mr Daithi McKay MLA
Northern Ireland Assembly
Parliament Buildings
Stormont
Belfast
BT4
Dear Mr McKay
Re. Subject: Finance and Personal Committee – 19 January 2011
Presbyterian Mutual Society
I understand that you are now to be Chairman of the above Committee. I have written on similar lines to your colleague Ms Jennifer McCann.
A number of PMS savers have asked me to write to the Chairperson in connection with the above Committee meeting held on Wednesday 19 January 2011.
The savers were disappointed to hear Committee members make reference to some of those who deposited their money in the PMS as 'speculators'. The rate of interest paid to depositors by the PMS was six per cent gross. You will realize that after Income Tax is deducted the saver is left with just over four and a half per cent. Surely your members do not consider four and a half per cent net to be speculating. During the operating life of the Society many financial institutions were paying in excess of that rate of interest on long-term products. Indeed those who deposited their money in the Icelandic Banks earned rather larger interest than anything the PMS was ever in a position to award. You will also know that the United Kingdom Government bailed out those depositors and provided them with the Financial Guarantee Scheme.
The Oxford Dictionary, among other definitions of the word "speculate", gives the following "to take risks in the hope of gain". It would be stretching that or any other definition of "speculate" a long way to include in it all deposits earning four and a half percent interest. The savers concerned think that the Committee members appear to be confusing borrowers with savers in this respect.
Savers in the PMS were assured that there would be no speculating with their funds and the Treasury Select Committee found them to be totally innocent in this respect. By law the shares in an Industrial & Provident Society are not the same as those in other companies. They are not linked to the stock market and therefore do not increase or decrease in value. You put £1 in and you get £1 out. The shares simply acted as a membership ticket to the Society.
There is also a perception amongst your members that PMS savers are exclusively members of the Presbyterian Church and that it was a 'closed society' that was only open to members of the Church. This assertion is incorrect. There are members from other religious denominations who have funds deposited in the PMS including those of the Roman Catholic faith. Indeed I know of one Roman Catholic who deposited in excess of £1 million. During the High Court proceedings Mr Horner QC representing Mr Ernest Howie a non-Presbyterian, made the point to Lord Justice Deeny that one did not have to be a Presbyterian to join the Society.
Concerns have once again been highlighted regarding the high risk which the PMS Rescue Plan poses despite Mr. Bill Pauley's, (and on a previous occasion in the Assembly, Minister Wilson's), assurances that the Plan had been thoroughly examined by a reliable firm of Accountants, had been subjected to the department's Due Diligence Appraisal and was found to be viable. The Administrator's Business Plan had also been thoroughly scrutinized and accepted and also found to be viable. Indeed his audited six monthly accounts demonstrated that the income from the Society's assets are such as to allow not only the agreed interest on the loan to be paid but also to repay the capital sum off over the ten year life of the loan agreement.
Savers think that the fears expressed regarding the risk to the Assembly posed by the PMS Rescue Plan are therefore excessive.
In this context no cognizance appears to have been taken at the meeting that there was a fatal regulatory gap which led to the collapse of the PMS and that had there been a proper regulatory framework in place innocent savers would not be in this position. In respect of savers with £20,000 or less on deposit, had there been a proper regime in place for putting an Industrial & Provident Society into administration as opposed to relying on company law 'mutuality' would not be an issue. It therefore must be remembered that Stormont has a clear responsibility and duty to ensure that savers are fully compensated and returned to the financial position that they were in prior to October 2008.
There is also a misconception that it is only savers with £20,000 or less that are suffering the most hardship and that larger savers are rich. This is incorrect. There are many larger savers in severe financial distress for a variety of reasons. One example is that elderly savers either sold businesses (on retirement) or homes with the intention of downsizing. The monies were deposited in the PMS as a stopgap only. Some had signed contracts to purchase new homes and have been sued for breach of contract only to find that they cannot meet the fines. They have had to rent homes at prices they can ill afford. Those who sold businesses face serious debts to HMRC.
I would be most grateful if when you next have an opportunity that you would urge the members of your Committee as public representatives to please ensure that their comments are based on fact.
May I also say that the delay in resolving this issue is utterly intolerable and manifestly unfair particularly for those who are hard pressed. The majority of savers are pensioners some of whom are in their nineties and time is not on their side. We have already suffered too many broken promises, false hopes, deadlines passing, a plethora of confusing statements and still savers do not know when they will see their savings again. The NI Assembly has both a moral obligation and a duty to ensure that 10,000 savers many of whom are suffering on a daily basis receive the justice that was envisaged when the Prime Minister promised a speedy fair and just solution. PMS savers have been penalized too severely for far too long in comparison with other UK Citizens.
I would therefore urge you to please use your influence where you can to bring this matter to a conclusion at the earliest opportunity so as to bring this suffering to an end.
Thank you.
Yours sincerely
Isobel Whyte (Mrs)
Lobby Coordinator
OFMDFM News Release
OFMDFM News Release - JOINT DECLARATION BY THE DEVOLVED ADMINISTRATIONS
OFFICE OF THE FIRST MINISTER AND DEPUTY FIRST MINISTER
2 February 2011
Joint declaration by the Devolved Administrations
In October 2010, the Scottish Government, Northern Ireland Executive and Welsh Assembly Government issued an unprecedented joint declaration to the UK Government in advance of the UK Comprehensive Spending Review.
Central to this statement was our shared belief that the Coalition Government's plans to cut spending too far and too fast run the risk of stalling the economic recovery.
It is now clear that the recovery is indeed fragile, as demonstrated by last week's UK GDP figures which showed a fall in output for the final quarter of 2010. Private sector demand remains fragile and a number of emerging factors, including relatively slow growth in our major trading partners and rising commodity and consumer prices, only serve to increase the risks to future growth.
In such times it is critical that the public sector stands ready to respond flexibly to such pressures.
While we recognise that budgetary responsibility is vital in returning the public finances to a sustainable footing, we continue to believe that the best way to achieve this is through the promotion of economic growth. This must be our overriding priority at this stage.
In the light of this, we collectively call on the UK Government to take urgent action in three areas:
1. Support economic recovery by investing in infrastructure.
The decision to accelerate public sector capital investment at the height of the recession was a considerable success in the Devolved Administrations. Growth in construction sector output will help to drive the recovery and deliver a welcome boost to employment.
It is essential that we build on this success. However, the planned cuts in capital budgets next year put this in jeopardy. We call on the UK Government to provide resources and flexibility to enable cost effective, and targeted, additional capital investment programmes to support growth and protect jobs. We therefore call on the UK Government, as part of this, to reverse its unilateral decision to write off accumulated stocks of End-Year Flexibility. These stocks – amounting to several hundred million pounds previously allocated to Wales, Northern Ireland and Scotland but not yet spent – should be restored to the devolved administrations to support the economic recovery. We also call on the UK Government to provide additional flexibility to the Devolved Administrations to grow their economies, including revenue raising and borrowing, without impacting negatively on their block grant.
2. Address Access to Finance
It is clear that securing affordable finance remains a considerable challenge for many of our companies. This is particularly true for many small and medium sized firms – the bedrock of the Scottish, Welsh and Northern Irish economies.
It is unacceptable that many businesses are being prevented from expanding or are faced with significant increases in lending charges and we need to ensure there is in place transparency and accountability in the flow of finance for SMEs. We must also ensure that the planned £1.5 bn Business Growth Fund is implemented now to support lending to viable companies.
3. Action to counteract rising fuel and transport costs
In recent months we have witnessed a sharp increase in fuel prices as a result of rising oil prices. These increases have been compounded by last month's rise in VAT and fuel duty. As a result petrol prices are at now record highs.
We call on the UK Government to take urgent action to address the rising price of fuel by postponing the scheduled duty increase in April 2011. This would help stimulate the wider economy by protecting motorists, road hauliers and in particular remote rural communities from high and volatile fuel costs
These are issues of tremendous importance. Economic growth is necessary if all of our people are to prosper. Economic growth is necessary to support the creation of sustained job opportunities for those currently facing unemployment, including a potential lost generation of young people. We have and will continue to raise these issues with the Coalition Government.
Notes to editors:
1. Media enquiries to the OFMDFM Press Office on 028 9037 8142 or out of hours contact the Duty Press Officer via pager number 07699 715 440 and your call will be returned.
Follow the Executive online:
http://www.northernireland.gov.uk/ http://twitter.com/niexecutive http://www.flickr.com/photos/niexecutive/ http://www.facebook.com/niexecutive
ICTU response to Draft Budget